Weisang for Saarstahl: Data acquisition, visualization and analysis on a rolling mill

06.09.2016

Weisang implemented a system for the high-performance wire rod mill (capacity: 1,000,000 metric tons/year) to capture, analyze and store its data.

The mill has a single strand at the entry point (annealing furnace) and splits twice along the way, ending up with four strands. The rolling mill produces wire rod material (5 to 15 mm in diameter) around the clock. The raw material (billet) is run through a blooming mill to end up with the required dimensions as it moves along the mill path, is measured by laser diameter gauge at the end and is then placed on a cooling line in the shape of coils. After cooling, the material is bundled and stored as coils.

The system has a material flow tracker (MFT) which, combined with photodiodes and temperature cameras, makes order-based tracking of the billets through the entire system possible. Signals for temperature, water consumption, water pressure, speed and other factors are recorded continuously along the mill path.

At process-relevant points in the system, which spans several hundred meters, there are control stations with personnel who use data measured at their location to manually control the system, regulate the mill process or even stop the system in the event of a malfunction.

 

The following features were required for the data acquisition and analysis system

  • Ability to capture measured data from all implemented systems along the rolling mill (MFT, laser diameter gauge, Interbus)
  • Delivery of relevant measured data to the individual control stations practically in real time. The data were to be visualized in a processed format (graphs, value indicators, warning symbols, etc.) for customized visualization at any time.
  • Order-related collection of all measured data with analysis capability, e.g. SPC.
  • Storage of years of collected order data in an archive that can hold several years of measured data while providing the ability to analyze it at any time.
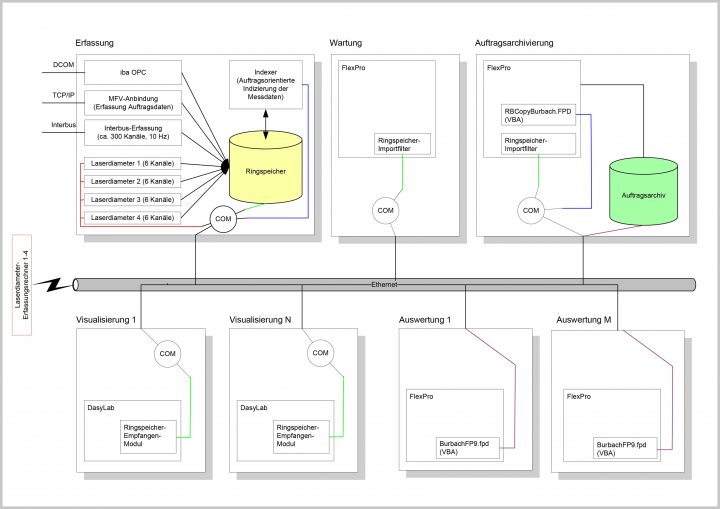
System structure overview

Data acquisition

The capture of the data recorded in the rolling mill is split into several subtasks that are distributed to the different components (programs). The following details the types of data captured:

  • Interbus data: Data captured by Interbus throughout the rolling mill. The data log rate is 10 Hz.
  • MFT data: ID and order data, which are sent by cable from the material flow tracker, are appended to the numeric data for subsequent assignment of the measured data to orders. These data usually appear randomly.
  • Laser diameter gauge data: The utility program provided by Zumbach with the laser diameter systems includes an interface that allows the data measured there to “subscribe” and to be stored for further use in the ring buffer database.

Online visualization

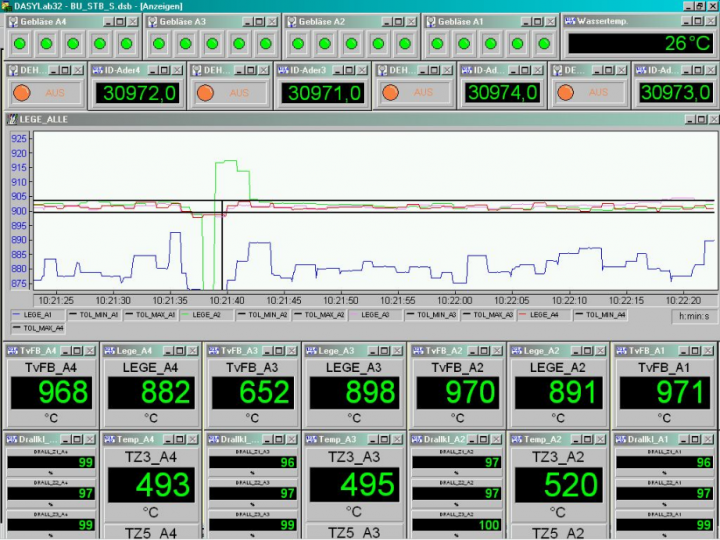
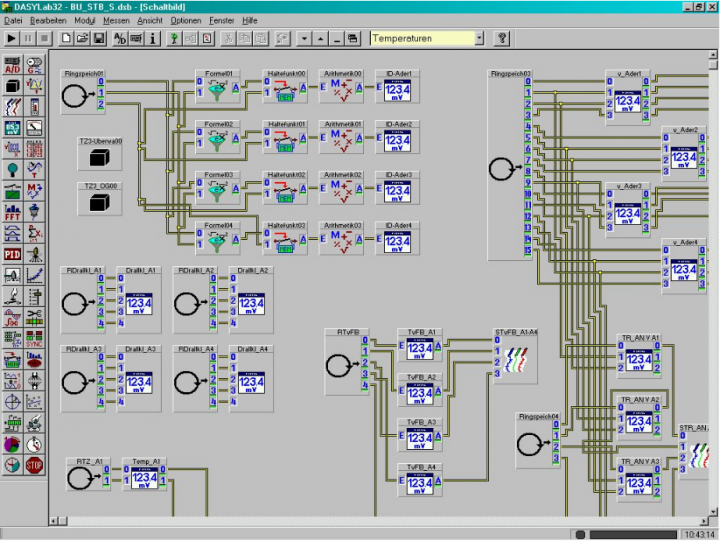
Visualization of the data is handled by DASYLab data acquisition and visualization software. The DASYLab circuit diagrams were customized depending on the application. Using a special DASYLab “ring buffer database receiver” module, the required data are subscribed directly from the HistoryBase server, i.e. the data are sent from the ring buffer database to the module as soon as they arrive there. The receiver module is used in DASYLab in a similar way as a measuring card module.

Analysis of order-related data

FlexPro runs on a dedicated computer (described in the system illustration as the order archive) with a specially designed archive plugin. Periodically this plugin searches for completed billets in the ring buffer (the billet is considered complete when it has run through the entire mill). When found, the billets are sorted in a FlexPro database by their order ID. After a cycle has been completed, all orders receiving new billets during the cycle are compressed and stored outside of the FlexPro database in a data archive which is available on the network. The archival process is concluded when the index for rapid searching in the order archive is updated.

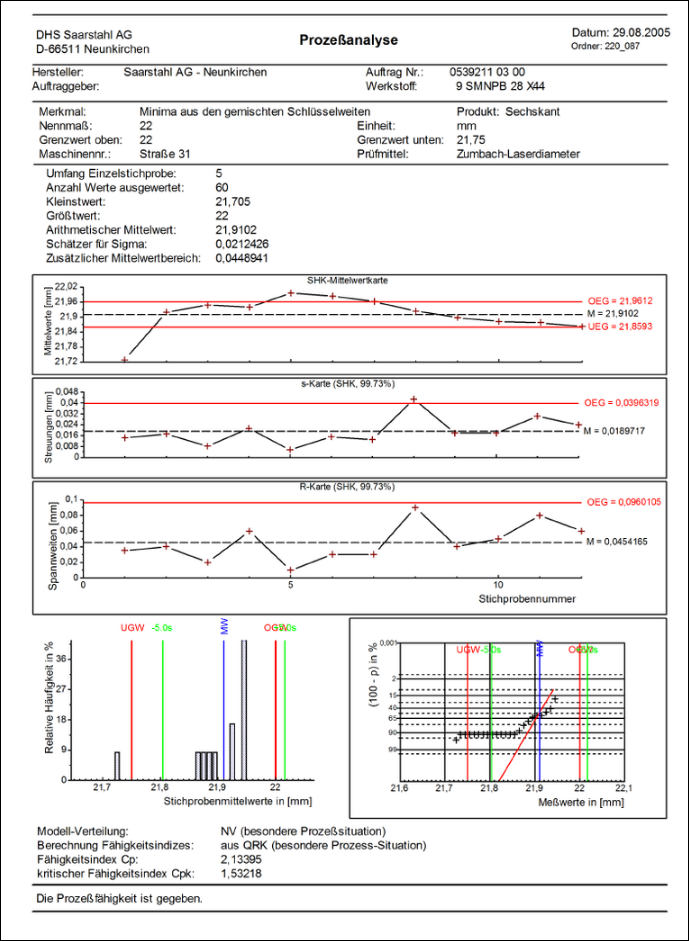
The analysis itself is based on the archive produced during the archival process. Authorized personnel have file access to the order archive via the LAN and can use a FlexPro extension to run fixed or flexible analyses on the archived data for order analysis. The individual analyses are guided using a wizard and always start by selecting the data to be viewed, which can be selected in different forms depending on usage. The analysis-specific options are then selected. After the wizard is finished, the required data from the order archive is imported into the particular user’s FlexPro project database. The required analysis is then conducted. The adjacent picture shows an example of a document with SPC analysis results.

SPC analysis

Share article or send as email: