Siemens: Measured data analysis in the traction power network using FlexPro software

05.10.2003

Standard software masters complex railway operation simulations

Simulations produce large volumes of data. The goal was to work out the right parameters from the variety of data in order to design traction power networks. Using standard software for measurement analysis made it possible to fulfill these requirements and allowed the simulation software developers to focus on their core task.

Designing traction power networks using normal calculations is very difficult to do. The interaction between the large number of components is very complicated. Simulations were used to avoid excessive overdimensioning. In the simulation trains can run according to a timetable. For this purpose they require electrical power input or they return the electrical power during braking. The required electricity flows across the power supply network.

Many definitions are required so that the simulations can run realistically:

  • Topography:
    Position of train stations, gradients, curves, tunnels, bridges, speed limits, etc.
  • Topology:
    Interconnection of the traction power network electrical components
  • Vehicle data:
    Weights, rotating masses, train resistances, electrical parameters, degrees of efficiency
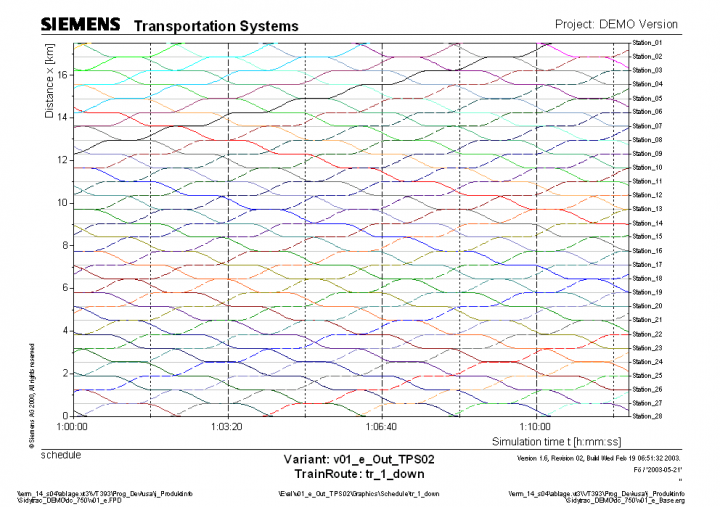
  • Timetables (Fig.1)
  • Variants

The behavior without and with breakdowns is calculated from one each up to 30 substations.

Fig. 1: Graphical representation of a timetable as the route over time (left scale: route; right scale: stations. Every line is a train, horizontal segments are stations).

The calculation is made in increments of time. The electrical network, which is dependent on the location of the vehicles, is calculated at each point in time. All voltages and currents are calculated for this network depending on the power required for the vehicles. The calculation results are data files which are similar to measurement files. A few hundred “measured quantities” occur in the response time: currents, voltages, potentials, outputs, locations, etc. Of these quantities, the mean values, effective values, maxima and minima are required. Other factors include derived quantities such as outputs, power, unbalanced loads in the three-phase supply network, leakages and phase angles.

The quantities were not to be output based on time only, but also to a certain extent based on location, e.g. the highest and lowest potential along the track, the highest and lowest voltage along the track, the average and effective currents in the overhead cable and rails. The input parameters were also to be output: inclines over path, height over path, current limits of the vehicles over voltage depending on the operating state, train resistances over speed and timetables as the location of the trains over time. After completing the calculations, a comparison was to be made between variants. Request: Primarily automated preparation of HTML documentation for the calculated simulation results submitted to the customer. The HTML documentation consists of tables and graphs. Standard software was to be used to reduce the development costs for the analysis and presentation of the simulation results.

Initial version

The company selected the FlexPro analysis software by Weisang primarily for the following reasons:

  • The hierarchically organized object database, with a size limited only by the size of the hard disk, provides the ideal organizational structure for the simulation results.
  • FlexPro features a powerful script language (FPScript) that can be used to calculate real and complex time signals.
  • The parameters for the diagrams and tables can be freely adjusted, also making it possible to create specific charts and other graphical representations, such as a timetable chart.

The first approach for FlexPro 5 was to produce a special import filter for the result text files generated by the simulation software, which placed the hierarchical, computed results in a subtree of a FlexPro object database after the import was manually activated. The documentation was produced semi-automatically without HTML output. A high level of automation was already achieved in the process thanks to extensive use of the FPScript formula language.

Full automation

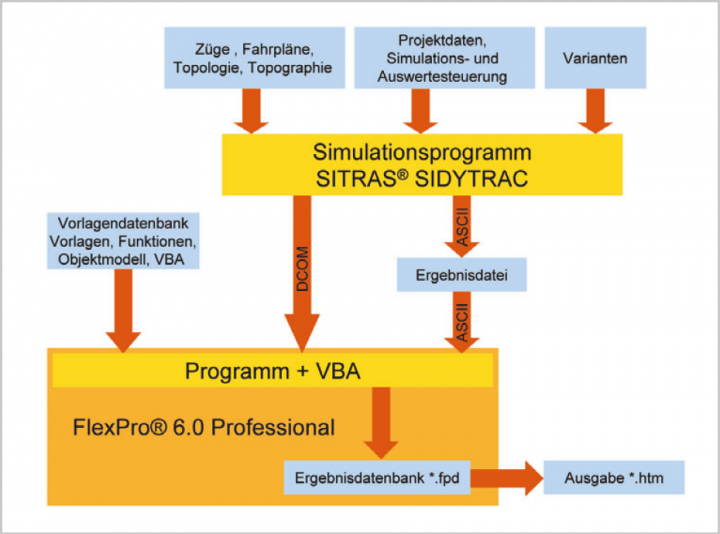
With the release of FlexPro 6 Professional, there was nothing to stand in the way of almost fully automating the simulation analysis. This version provided access to all program elements through automation interfaces (Objektmodell), so dass zuvor noch manuell ausgeführte Schritte nun mittels des integrierten VBA (Microsoft Visual Basic for Applications) automatisiert werden konnten. Durch den ebenfalls neu vorhandenen HTML-Export war auch das gewünschte Ausgabeformat realisierbar. Die Implementierung der Automatisierungsroutinen wurde von Weisang in enger Zusammenarbeit mit Siemens durchgeführt, wobei die Pflege des fertigen Projektes durch Siemens angestrebt und durch Schulung der Mitarbeiter sichergestellt wurde. In der endgültigen Lösung werden die Varianten wie zuvor auf mehreren Rechnern parallel berechnet. Die Simulationsrechner schreiben nun keine Ergebnisdateien mehr, sondern übertragen als Clients die Simulationsergebnisse direkt über Automation (DCOM) in eine Datenbank, die auf einem vorher bestimmten Server ausgeführt wird (siehe Abb. 2).

Fig. 2: Coordination between program components: input data specify the HTML output across the simulation program and the DCOM interface in FlexPro.

The particular simulation computer initiates the analysis on the server computer after completion of the simulation data transfer. After calculating all variants, the last client triggers calculation of the variant comparison. The export of the entire analysis as a navigable HTML Web document in a folder designated for the project links to the variant comparison calculation. The type of data to be output is pre-defined in the input files for the simulation computer. The simulation program controls the necessary FlexPro functions and macros via the DCOM interface. The database contains all of the relevant data independently of the output. It is also possible to view multiple analyses at the same time, making it considerably easier to obtain an overview and comparison between the computers.

Implementation and key data

The diagrams and tables used are saved in a template folder. The templates are copied and, if absolutely necessary, are modified via automation in order to maintain the highest degree of flexibility. The size of the template database is 5 MB. Two languages can be selected for the output. The template database contains the analysis functions, pre-designed diagrams, worksheets and tables. It is still possible to conduct special analyses, such as for troubleshooting or for specific queries. All of the macros can be run manually as well. The volume of accruing data is up to 600 MB, including the calculated values. The complexity of a vehicle simulation can be seen in the following computer runtimes: The duration of the timetable simulation ranges from a few minutes up to 12 hours per variant (2 GHz PC), depending on the complexity of the basic track system and timetable. The analysis per variant can take up to four hours of computing time and the variant comparison can take up to six hours. VBA programming of the software is done based on the same object model as the simulation program.

The related VBA project details are as follows:

  • 27 class modules
  • 34 modules
  • 4 formulas

The graphical output is quite substantial:

  • 500 graphics with a total of 3000 quantities per variant.
  • 22 tables per variant plus 10 tables for the variant comparison. The tables have several hundred rows each.

Result

With the decision to use the standard software FlexPro, it was possible to reduce the development cost for simulation data analysis considerably. In particular, combining the strengths of VBA and the FPScript formula language made it possible to minimize the programming costs. By using templates for documents, tables and diagrams, simple changes could be made without significant programming expenses (e.g. for rendering in a different output language). The high level of automation gives engineers the ability to concentrate more on optimizing the traction power network.


Author: Thomas Greif, Dipl.Ing. (FH) Head of Systems Engineering Traction Power Supply, Siemens AG

Article from “MessTec & Automation 9/2003”

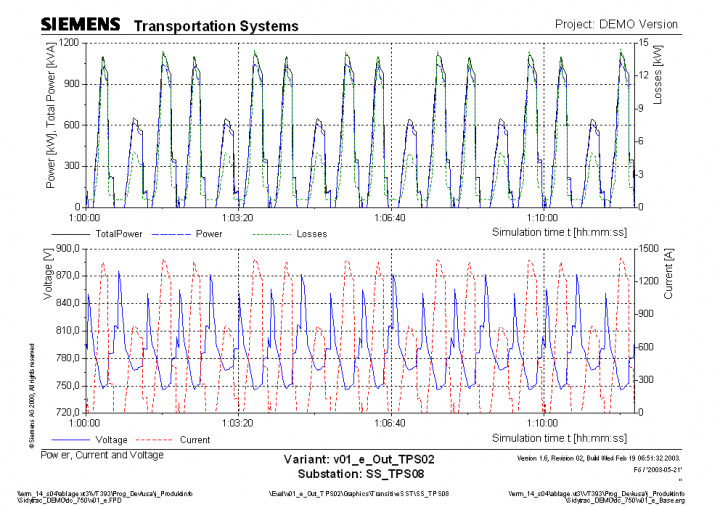
Fig. 3: Typical task for a substation. Top: Input output, effective DC power, loss; bottom: voltage and current

Share article or send as email: