Data acquisition and analysis on a dynamic pressure pulsation test bench at Bosch

05.09.2016

The test bench is used as a reference sensor for automated measuring of high-precision pressure sensors while pressure, pressure type, frequency and temperature are altered.

The key components of the test bench are a conditioning cabinet in which up to 10 units under test and the reference sensor can be mounted on a rail, and a hydraulic system for dynamic pressure generation that is controlled and regulated using a PLC. These components were manufactured and supplied by FMB-Blickle.

A Yokogawa WE7000 data acquisition system was used to collect the data at a sampling rate of up to 100 KHz and to set the curve for the pressure progression.

The two software components for operating the test bench and analyzing the test data were developed by Weisang. The HistoryBase ring buffer database was used for data management and as an interface between the data acquisition and analysis components. The analysis was done using FlexPro.

Process control, data acquisition and visualization

This core software component for operating the test bench handled the following tasks:

  • Creation and management of data sets for process control.
    Communication with the PLC via an OPC server interface to control the test bench.
  • Output of the target curve using a signal generator in the WE7000 system.
  • Data acquisition of dynamic pressure signals from the reference sensor and units under test.
  • Online visualization of the collected data.
  • Storage of measured data and of metadata assigned to the test sequences in the HistoryBase ring buffer database.

The software was implemented in Visual Basic. An ActiveX library was used for the online visualization. Communication with the PLC OPC server and the HistoryBase server took place directly over the corresponding COM interfaces. Communication with the Yokogawa measurement system took place using an API supplied by Yokogawa.

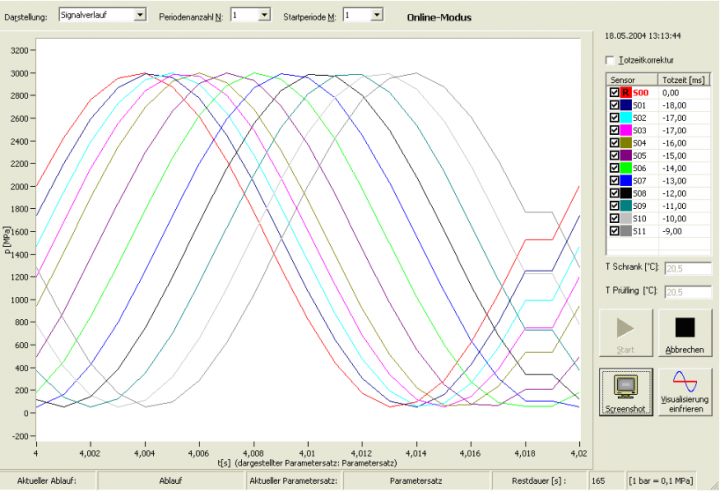
While a measurement was being taken or after each individual measurement, the data was visualized online, as shown in the following picture:

Analysis using the FlexPro analysis software

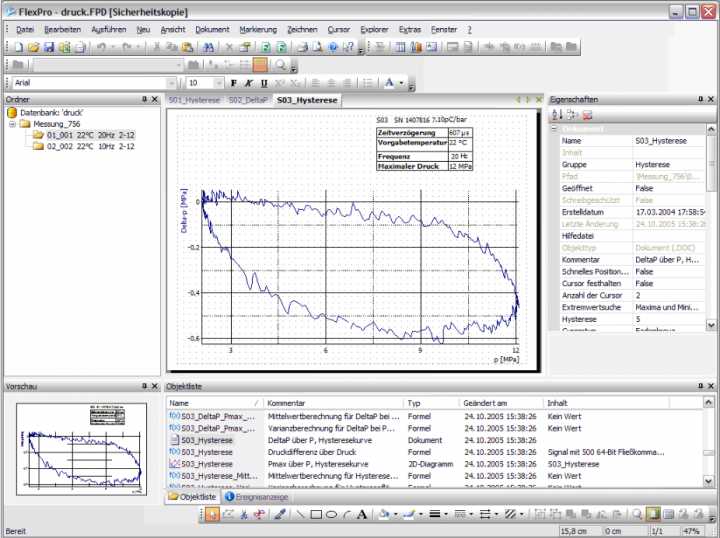
The data in the ring buffer database was analyzed using the FlexPro analysis software, which for this purpose was enhanced to include a special software component implemented in FlexPro VBA (Visual Basic for Applications). This component reads out the data from test sequences from the ring buffer and creates a structured document in the FlexPro format.

Synopsis

The HistoryBase ring buffer server in this application is the central link between the two software components running asynchronously and installed on different computers for data acquisition, visualization and analysis. User-defined data structures (UDTs) are used to organize numeric data in the ring buffer, thus making it possible during the analysis to assign them to the conducted test runs. The ring buffer database makes sure that not only the measured data but also all parameters entered when the test run was conducted are available for the analysis.

The ring buffer principle prevents the archived data pools from growing beyond a pre-defined maximum value. A blocking mechanism ensures that no data in the ring buffer is overwritten before it has been analyzed. On the whole, this results in a maintenance-free, fail-safe system.

Automated analysis in FlexPro

Share article or send as email: