Instantaneous Quantity Analysis Object (Spectral Analysis Option)
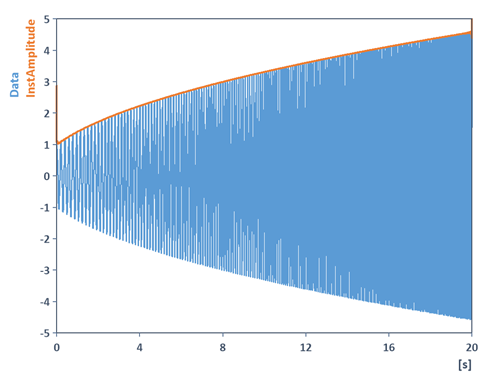
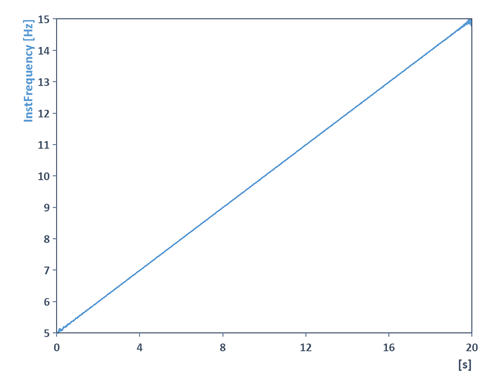
Use this analysis object to determine instantaneous quantities (instantaneous amplitude, instantaneous phase and instantaneous frequency) of signals. The instantaneous amplitude results in the amplitude response, the instantaneous phase results in the phase response and instantaneous frequency results in the frequency response of the signal to be analyzed. If the basic signal does not have a trend, the instantaneous amplitude will likewise match the upper envelope of the signal.
The instantaneous quantity calculation is suitable for single-component signals only.
In the following example, the instantaneous amplitude and instantaneous frequency of an amplitude modulated swept frequency cosine is determined with the help of the Instantaneous Quantity analysis object :
The instantaneous quantities can therefore also be used for demodulation of signals (amplitude demodulation, phase demodulation, frequency demodulation). More information about the AnalyticSignal function is available in the Online Help.
Algorithm
In English references, these instantaneous quantities are usually described as instantaneous amplitude (or instantaneous envelope), instantaneous phase and instantaneous frequency and are calculated using the Hilbert transform. More information about the Hilbert function or the AnalyticSignal function is available in the Online Help.
Parameter: FFT length
The Hilbert transform internally carries out a Fourier transform (FFT) of the data set. Using zero padding, i.e. by selecting the FFT length as greater than the data length, the resolution of the FFT required for the algorithm is increased. The calculation result can thus be improved. The following settings can be selected for the FFT length in the analysis object:
Option |
Description Data length |
Sets the FFT length to equal the data length. |
|---|---|---|
Next power of 2 |
Sets the FFT length to equal the next highest power of two. |
|
Parameter: Remove trend
For signals with a trend or offset, the trend must first be removed before finding the instantaneous quantities. The following options are available in the analysis object. The first three options match the options for removing the trend of the analysis object for signal analysis. You also have the option of correcting the trend by calculating the floating mean values:
Option |
Description |
|---|---|
Constant |
Subtracts the mean value of the data set. |
Linear |
Subtracts the best straight line, i.e. the straight line for which the sum of the squared deviations is minimal to the data set. |
Adaptive |
Subtracts the mean value from the upper and lower envelope. The setting can be used if the existing trend is neither constant nor linear, but is time dependent. |
Floating mean value |
Subtracts the floating mean value. The floating mean value required to form the interval width can be entered. The setting can be used if the existing trend is neither constant nor linear, but is time dependent. |
DC Offset Filter |
High pass filter to remove the DC offset (IIR Butterworth high pass). The cut-off frequency and the order (i.e. slope) of the high pass filter can be adjusted. The filter can be used if the present trend is neither constant nor linear, but time-dependent. |
When determining the constant or linear trend, first the mean value of the signal is calculated and then the first and last level crossing are searched using this value. If two level crossing were found, then the mean value or the best straight line is calculated only for the range between these two level crossings. This prevents errors that occur due to the phase segment of periodic signals at the ends of the data set. If no level crossings were found, then all values are included in the calculation. Suitable settings for removing a time-dependent trend are usually the subtraction of the moving average and the DC offset filter.
Example and Details
More information and details on the example above can be found in the Online Help covering the AnalyticSignal function.