Histogram (FPScript)
Creates a histogram for a class division that you can specify.
Syntax
Histogram(DataSet, ClassLimits)
The syntax of the Histogram function consists of the following parts:
Part |
Description |
|---|---|
DataSet |
The data set for which a histogram is created. Permitted data structures are data series, data matrix, signal und signal series. All numeric data types are permitted. For complex data types the absolute value is formed. If the argument is a list, then the function is executed for each element of the list and the result is also a list. |
ClassLimits |
A data series with the class limits for the histogram. The class limits do not have to be equidistant. Permitted data structures are data series. All real data types are permitted. The unit has to be compatible with that of parameter DataSet. The values must be strongly monotonously increasing. If the argument is a list, then the first element in the list is taken. If this is also a list, then the process is repeated. |
Remarks
The data type of the result is always 64-bit floating point.
The structure of the result corresponds to that of the argument DataSet.
The function works with open marginal classes and provides the absolute frequencies in the individual classes as a result.
When a signal or a signal series is counted, the X component of the result contains the midpoints of the class division specified. However, since the function works with open marginal classes and thus their widths are indefinite, the same width is assumed for the marginal classes to calculate their class centers as for their direct neighbor classes.
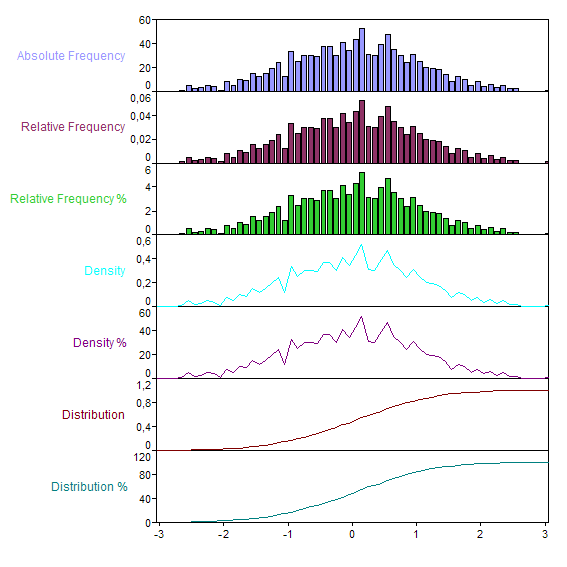
The following illustration shows the histogram of a normally distributed sample:
Available in
FlexPro Basic, Professional, Developer Suite
Examples
Histogram({1, 9, 7, 5, 7, 6, 10, 2, 4, 2, 7}, (10, 0.5, 1))
Results in {0., 1., 2., 0., 1., 1., 1., 3., 0., 1., 1.}. Creates a histogram. Since the function works with open marginal classes, the following 11 classes are defined: Values less than 0.5, [0.5, 1.5), [1.5, 2.5), ..., [8.5, 9.5), values greater than or equal to 9.5.