Order Filter Analysis Object (Order Tracking Option)
The Order Filter analysis object calculates order tracking for speed-dependent vibrations by bandpass filtering individual orders. Vibrations measured on rotating machines exhibit a spectrum in which maxima occur at frequencies corresponding to a multiple of the machine's speed. There are two different causes for the occurrence of these maxima. On the one hand, the machine can be considered a non-linear transmission system, which is excited with a harmonic vibration corresponding to the rotational speed. The non-linearity generates harmonics of this basic vibration, which lead to corresponding maxima. On the other hand, such a machine may contain components whose speed is not equal to the basic speed, but always corresponds to a fixed multiple of this speed. For example, different shafts in a gearbox have different speeds. But also the teeth of a gear or the balls in a ball bearing generate vibrations that are in a fixed relation to the speed. If this ratio of the fundamental frequency of a component to the fundamental frequency of the machine is known as the order, then individual maxima in the spectrum can be specifically assigned to a single or a few components of the machine. This can be used, for example, to isolate the cause of resonances.
In the method used here, a sampling rate conversion of the time signal is first performed (revolution synchronous resampling) so that the signal is no longer present in temporally equidistant steps, but in equidistant rotation angle steps (i.e. equidistant rotation intervals). This provides an effective method for performing order tracking, since ordinary band pass filtering of the signal converted to the revolution domain (i.e. using a suitable IIR band pass filter around the respective order) then provides the individual order curves directly (for details, see RevolutionSyncSampling:
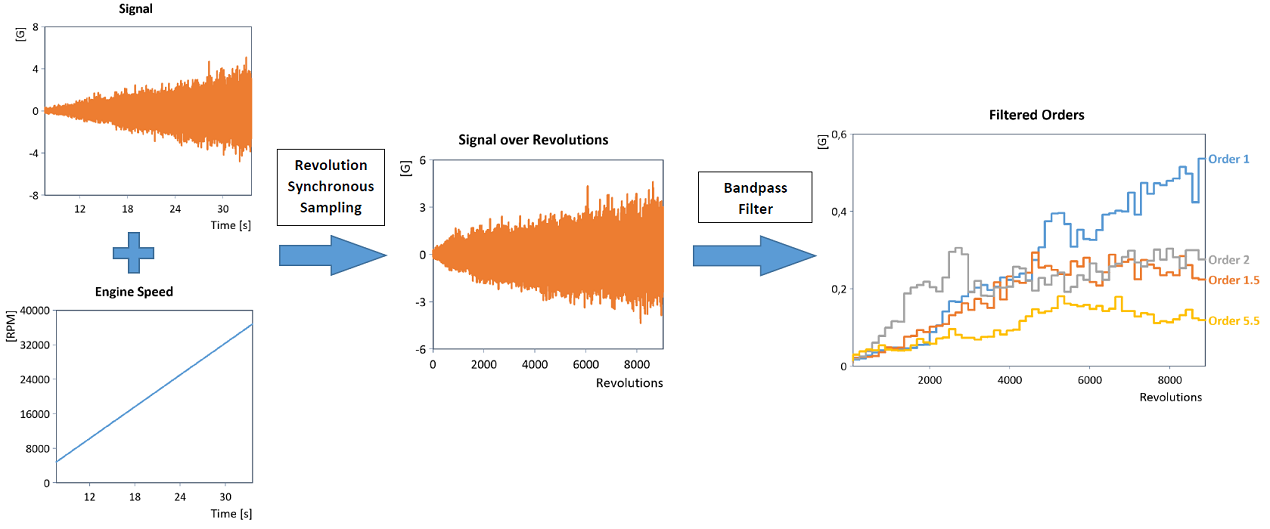
The Order Filter analysis object (in contrast to the analysis object Revolution Synchronous Order Tracking) allows the calculation and return of the filtered orders in the original time domain. The analysis object can therefore also be used for acoustic analyses of the filtered orders.
Two measurement methods are predominantly used for order tracking. During a ramp-up, the vibration and the instantaneous speed are measured synchronously, while the machine is usually ramped up slowly from its minimum to its maximum speed (run-up analysis). In a second method, the machine is first brought up to a certain speed and then a vibration measurement is taken for this speed (order tracking with constant speed). The Order Filter analysis object supports both variants. Order tracking using revolution synchronous resampling is also very flexible and can even be performed for noisy as well as non-monotonic speed data sets.order tracking with variable speed).
Data tab
This is the tab where the input data and parameters for transformation from the time to revolution domain are specified (for details, also see RevolutionSyncSampling):.
Signals in the time domain
The time signal to be analyzed for the analysis object must be in the data structure Signal. The Speed can be specified either in the Signal data structure (corresponds to a run-up analysis with variable speed) or as a scalar value (corresponds to order tracking with constant speed or to a fixed fundamental frequency).
If there are no units or unit management is switched off, the speed is always interpreted in the unit [1/min] (rpm) and the X component of the time signal is interpreted in the unit .
The instantaneous speed is often measured with a pulse encoder, which records a certain number of pulses per revolution. You can convert the resulting pulse signal directly into a speed signal. To do this, select the Speed is pulse signal option and specify the Number of pulses per revolution. The conversion of the pulse signal into a speed signal is done with the ImpulseToFrequency function.
Resampling into the revolution domain
Three different modes are available for resampling from the time to the revolution domain. In most practical applications, linear resampling is sufficient:
Resample method |
Description |
|---|---|
Linear interpolation |
The time signal is evaluated at the (non-equidistant) time points of the equidistant revolution sampling points by means of linear interpolation before being transformed into the revolution domain. This makes the transformation fast, but can cause aliasing in the subsequent FFT analysis of the revolution-based synchronous sampled signal. |
Spline interpolation |
The time signal is evaluated at the (non-equidistant) time points of the equidistant revolution sampling points by means of spline interpolation before being transformed into the revolution domain. Compared to linear resampling, spline interpolation is slightly slower, but aliasing is reduced. |
FFT resampling |
The time signal is evaluated by FFT resampling at the (non-equidistant) time points of the equidistant revolution sampling points before being transformed into the revolution domain. Here, the time signal is first transformed into the frequency domain, where zeros are appended and then transformed back into the time domain. Resampling by means of Fourier transform leads to an almost ideal result, since no high-frequency signal components are added. Aliasing effects in the calculation of the order spectrum are almost absent, but the calculation time is increased significantly. |
If the splines or the FFT resampling method is selected, a resample factor must be specified by which the sampling rate of the signal is increased during the transformation algorithm.
Regardless of the resampling method selected, the Number of data points per revolution for the signal transformed into the revolution domain must be specified. This determines the sampling of the transformed signal in the revolution domain. According to the Nyquist sampling theorem half of the value determines the maximum order that can even be calculated.
To determine the Number of data points per revolution two modes are available:
Data points per revolution |
Description |
|---|---|
Automatic (adaptation to max. order) |
Calculates an automatic value for the number of data points per revolution so that the theoretically largest order occurring in the signal can still be calculated using Fourier analysis. The automatically calculated value can be limited by a freely adjustable limit value. |
Fixed value |
For the number of data points per revolution, any fixed value can be specified. |
Options tab
In this tab the Order Filter is specified for bandpass filtering of single or multiple orders. Here, ordinary IIR bandpass filtering is performed around the respective order of the signal transformed into the revolution domain (for details, also see RevolutionSyncSampling).
Output
The following four output modes for the Order Filter analysis object are available:
Mode |
Description |
|---|---|
Filtered orders (as a list) |
Calculates the filtered orders. These are returned as a list. |
RMS curves of filtered orders (as a list) |
Calculates the RMS curves of the filtered orders. These are returned as a list. |
Filtered orders (as a signal series) |
Calculates the filtered orders. They are returned as a signal series. |
RMS curves of filtered orders (as a signal series) |
Calculates the RMS curves of the filtered orders. They are returned as a signal series. |
Sum of filtered orders |
Calculates the sum of the filtered orders. The return result is a signal. |
RMS curve of the sum of the filtered orders |
Calculates the RMS curve of the sum of the filtered orders. |
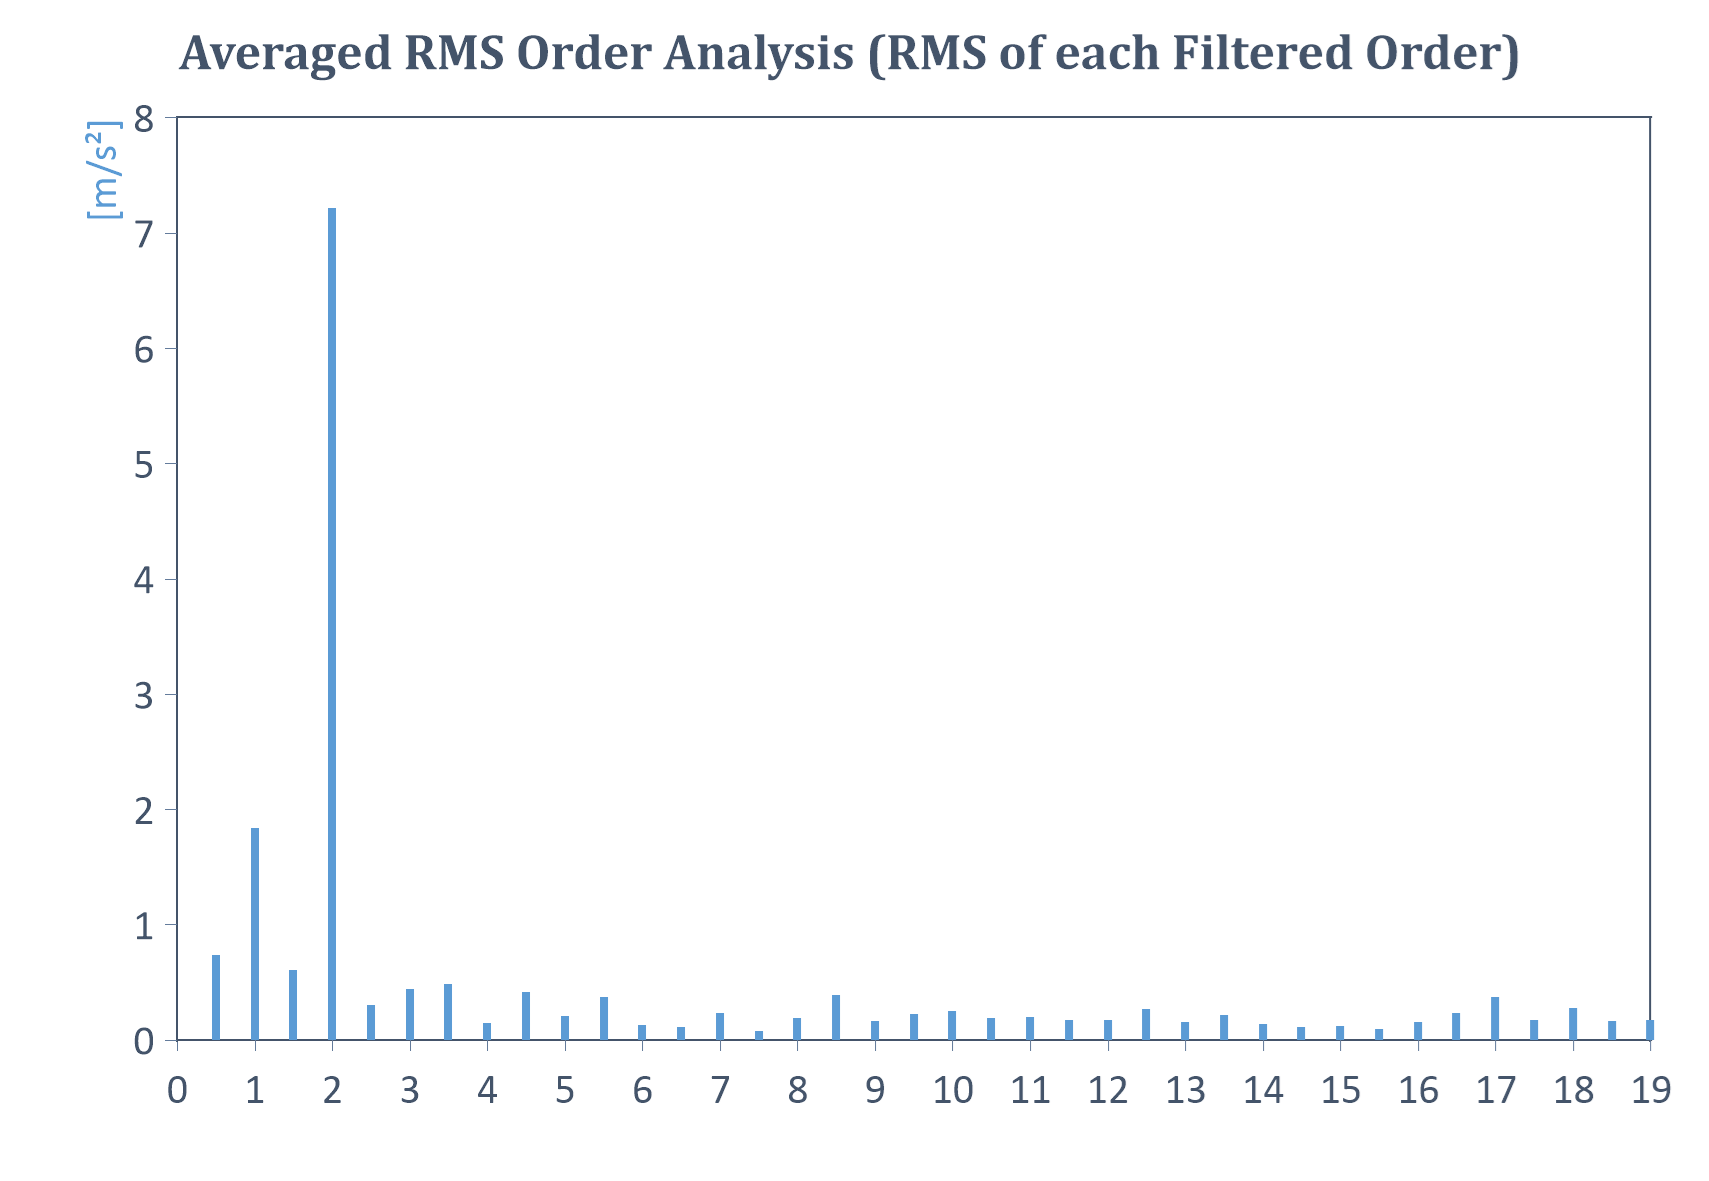
Averaged RMS order tracking (RMS of each order) |
Calculates the total RMS level of each order. The mode is suitable for order tracking at constant speeds. The return result is a signal (X = order, Y = RMS value). |
Bandpass filter
For calculating order curves, ordinary IIR bandpass filtering is performed around the respective order of the signal transformed into the revolution domain. The following bandpass filters are available:
Filter |
Description |
|---|---|
Butterworth |
An IIR Butterworth filter is used as the order bandpass filter. The filter order of the Butterworth filter can also be specified. Details IIRFilter function. |
Peak |
A special IIR peak filter is used as the order bandpass filter. This always has the filter order 2. For details, refer to the IIR peak filter function. |
Orders to filter
The orders to be filtered can be explicitly set in a table or taken from a data set. The selected orders form the midband frequency of the set bandpass filter. Order bandwidths can be expressed symmetrically around the order as 3dB filter bandwidths. The 3dB filter bandwidth defines the order range, outside of which frequencies are blocked out (defined by -3 dB point, i.e. point at which 70.7 percent of the original signal amplitude is reached).
RMS calculation
The following two RMS modes are available for calculating the RMS curves of the filtered orders (as a list or signal series) or for RMS calculation of the sum of the filtered orders:
RMS calculation mode |
Description |
|---|---|
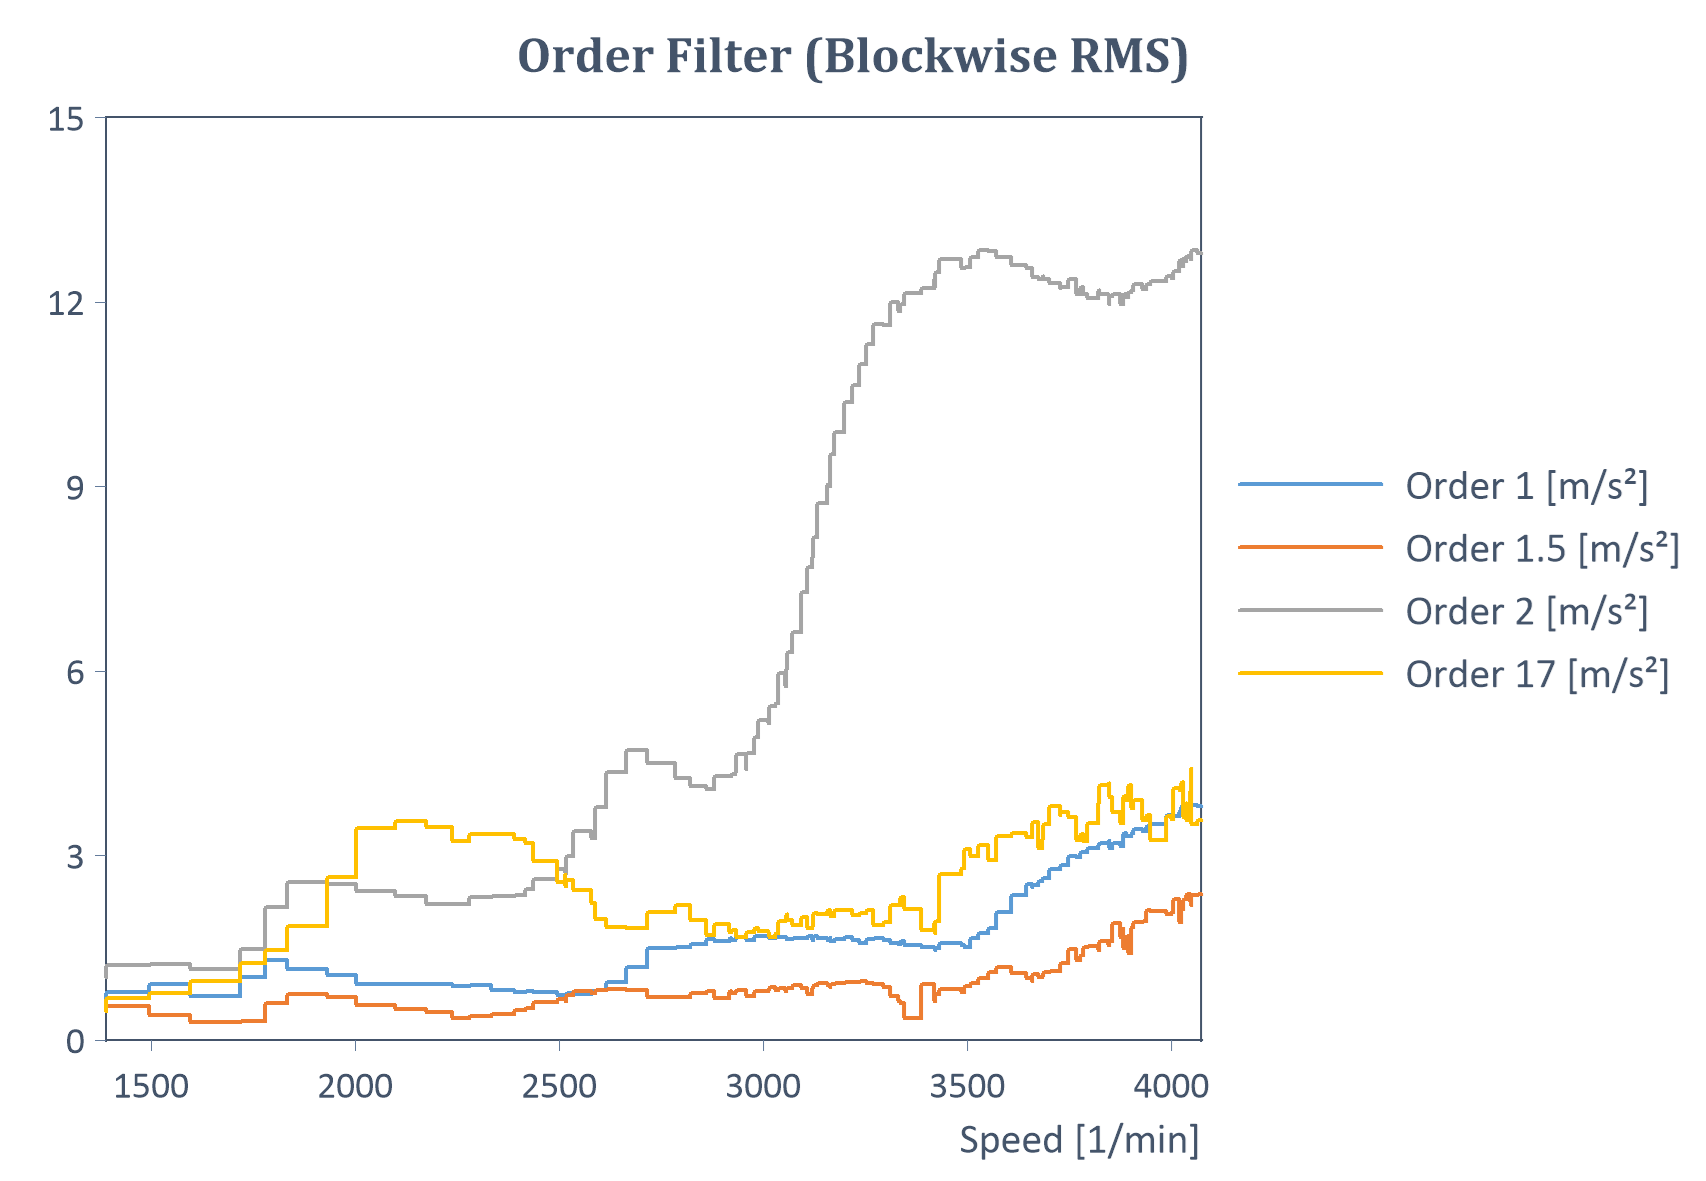
Block-wise |
Block-by-block RMS calculation (in the revolution domain). The block size (interval width) can be specified here in multiples of one revolution. |
Moving |
Moving RMS calculation (in the revolution domain). The block size (interval width) can be specified here in multiples of one revolution. |
Example of an order filter with block-wise RMS calculation for a run-up (with Y = amplitude, X = speed):
Result
For all output modes (with the exception of averaged RMS order tracking), the following result types are available:
Result |
Description |
|---|---|
Y = amplitude, X = revolution |
The amplitude curves of the orders are each returned across the revolutions. |
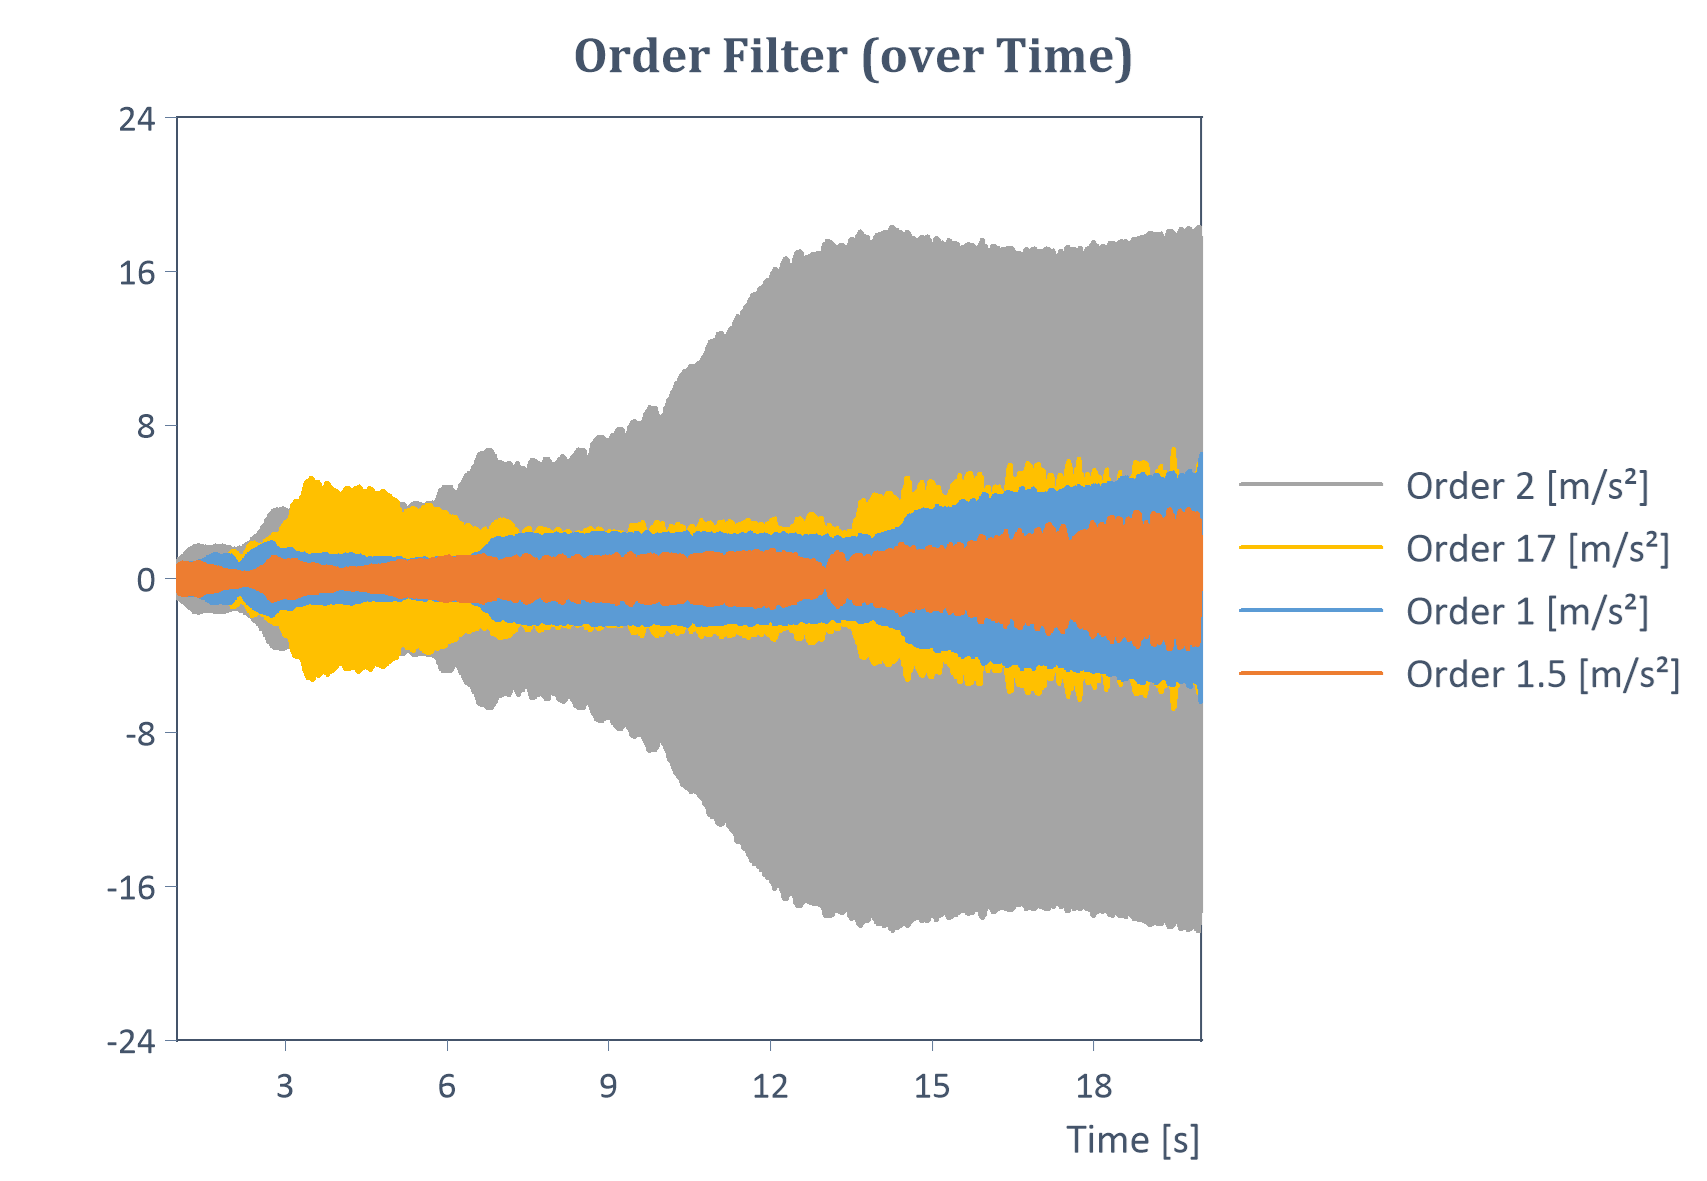
Y = amplitude, X = time |
The amplitude curves of the orders are each returned across the time. When outputting the filtered orders or with a moving RMS calculation of the order curves, it is possible to transform back to the original time base in each case. This allows the use of the analysis object for acoustic analyses of the filtered orders. |
Y = amplitude, X = speed |
The amplitude curves of the orders are each returned across the speed. It can be sorted monotonically in ascending order according to the speed. |
For result Y = amplitude, X = speed, the result contains non-equidistant speed sampling points (these correspond exactly to the equidistant revolution sampling points after filtering in the revolution domain). The result can therefore also be evaluated across an equidistant speed range with the Speed start, Speed end and Speed increment to be defined. Here, linear interpolation is performed across the specified equidistant speed range. For linear resampling to provide meaningful results, the speed resolution calculated by the algorithm should be sufficiently high (e.g. moving RMS calculation or block-wise RMS calculation with sufficiently small block size).
Note: The calculation of the (block-wise) RMS curves of the orders to be filtered provides curves similar to the analysis object Revolution Synchronous Order Tracking. For this purpose, in the latter analysis object the output mode Order cuts including RMS level extraction in order band must be set. The averaged RMS order analysis of both analysis objects provides the same results.
Example of an order filter across time for a run-up (Y = amplitude, X = time):
Example of averaged RMS order analysis for a constant speed signal (RMS of each filtered order):
Examples
In the project database C:\Users\Public\Documents\Weisang\FlexPro\2021\Examples\OrderT racking Analysis.fpd or C:>Users>Public>Public Documents>Weisang>FlexPro>2021\Examples\Order Tracking Analysis.fpd you will find examples of the different use cases and modes for which an order analysis can be performed. In particular, the diagrams above are included there.
FPScript Functions Used
See Also
Revolution Synchronous Order Tracking Analysis Object