Analyzing Data Mathematically
Traditional applications for data analysis use a number of analysis commands to generate new data sets from the raw data sets available, which then contain the results of the analysis. In FlexPro, however, you set up a dynamic network of analysis objects and formulas to evaluate your data. Each analysis object and each formula represent the result of an analysis, such as the mean value or the frequency spectrum of a signal. Formulas are programmed in the FlexPro FPScript analysis language. Analysis objects are special formulas that are managed by FlexPro and for which you can set parameters via the Properties dialog box. To calculate an analysis result, the FPScript code of the formula or the analysis object is processed to calculate the result. When processing the formula, FlexPro accesses the source data on which this formula is based and to which the formula is linked. For an analysis object, specify the source data to be used on the Data tab of the Properties dialog box. For a formula, use the source data as you would a variable in FPScript code. You can nest the object network that you are creating as deeply as you like. Not only can the source data of an analysis object or a formula be data sets, but the data can also be different analysis objects or formulas. For all objects that can supply data, i.e. for formulas, analysis objects and data link objects, FlexPro uses the term data object. You can use these types of data objects like data sets and display them as a diagram or table, for instance.
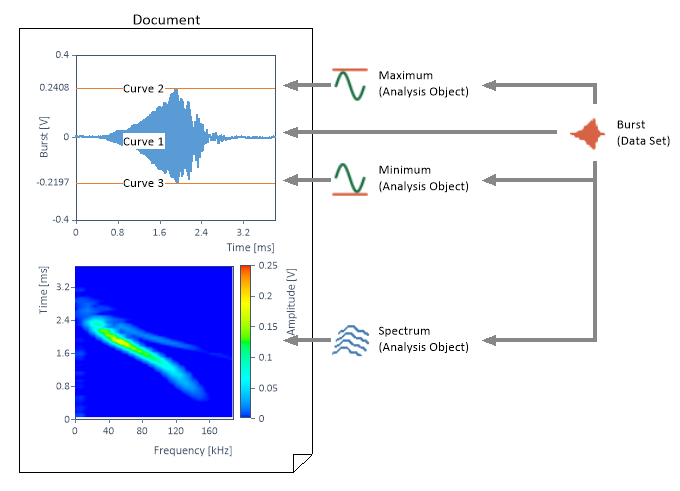
The following illustrates a simple analysis network:
The object-oriented data analysis from FlexPro has two distinct advantages over the conventional approach. First, you can modify the analysis objects and formulas at any time to optimize the analysis; second, you have the option of using the analysis that was created just once for as many new data sets as you would like without having to repeat all of the steps in the analysis. All settings that you make during the analysis remain stored in FlexPro’s network of data objects. After changing a setting or after importing new data, you only need to use the Update command to update all documents with the latest information.
If you are new to FlexPro and used the conventional methods for data analysis in the past, the object-oriented application from FlexPro will require some changes in your thought process. However, you will learn to appreciate the advantages of this method rather quickly.
Analysis Wizard
The Analysis Wizard offers you a wide range of ready-made analyses to choose from and creates a complete evaluation of the data sets selected by you. The final analysis does not only contain the desired calculation results, but as an option also contains specially adapted diagrams and tables that present these results. If required, the wizard can even create a finished document for your analysis.
Analysis Templates
You can store analyses created one time as an analysis template in the current database or in a template database. This type of analysis template consists of any network of interdependent objects. In the example above, these would be the document, the diagram within it, and three analysis objects. Objects in the lowest hierarchical level, i.e. those that do not depend on any other objects, are replaced by selected objects during subsequent use of the template, as long as they were not marked as belonging to the template when it was created. In the example above, this would be the data set. However, this can also be any other type of object, such as a diagram. You can then use the analysis templates in the Analysis Wizard to create new analyses or to apply it directly to the recently imported data during data import.
Analysis Automation
All analyses in FlexPro are created using analysis objects or formulas, allowing for automation of the analysis without any programming.
To update a document or worksheet, you only need to run the Update command. FlexPro then updates all diagrams, text and tables in that object. If, for example, a formula or an analysis object has been entered as a curve, FlexPro checks to see whether a new calculation is required and, if necessary, carries out the re-calculation. If, in turn, the formula uses other formulas and/or data sets in calculations, then this network is completely processed.
If you have set up data link objects for importing external data, the original data is accessed with each update, as long as it has changed since last updated. Changes thus affect the results immediately.
Smart Update
When you update a document or diagram, all of the formulas and analysis objects upon which this document is based are also updated. This type of network can quickly cover several hundred formulas. FlexPro "Smart Update" technology ensures that only the formulas with indeterminate results are re-calculated. If a formula was already calculated during a previous updating process, then the last result is re-used, if this is at all possible.
FlexPro checks the formula code here for vagueness, which means that re-calculation could provide a different result. Only those formulas are re-calculated for which this is the case. A typical example of a formula with a vague result is a formula that uses the Noise function or the Input function. Formulas that refer to data sets or results of other formulas are re-calculated if at least one of the data sets has been edited or if one of the formulas used has to be re-calculated.
FlexPro also ensures that each formula is not calculated more than once within a single update. You can therefore assume that a random signal used in several formulas represents the same instance in each of these formulas. An exception to this are formulas with arguments. These are always calculated.
However, "Smart Update" includes not only formulas, but presentation objects as well. For a diagram, FlexPro checks for each individual curve, for instance, to see whether it must be re-plotted.
Working with Analyses
Analyzing Multiple Measurements