Template Creation Tutorial
FlexPro templates let you reuse each analysis and presentation that you create as often as you wish. These examples illustrate how you can create analysis, diagram and document templates and how to differentiate between the different templates.
The examples are based on the project database called Creating Templates.
Open the project database. Switch to the folder C:\Users\Public\Documents\Weisang\FlexPro\2021\Examples\Tutorials or C:>Users>Public>Public Documents>Weisang>FlexPro>2021>Examples>Tutorials.
Select the Creating Templates.fpd project database and then click Open.
Analysis Template
The analysis template can contain an object network of any size. Objects in the lowest hierarchical level, i.e. those that do not depend on any other objects, are replaced by selected objects during subsequent use of the template, as long as they were not marked as belonging to the template when it was created.
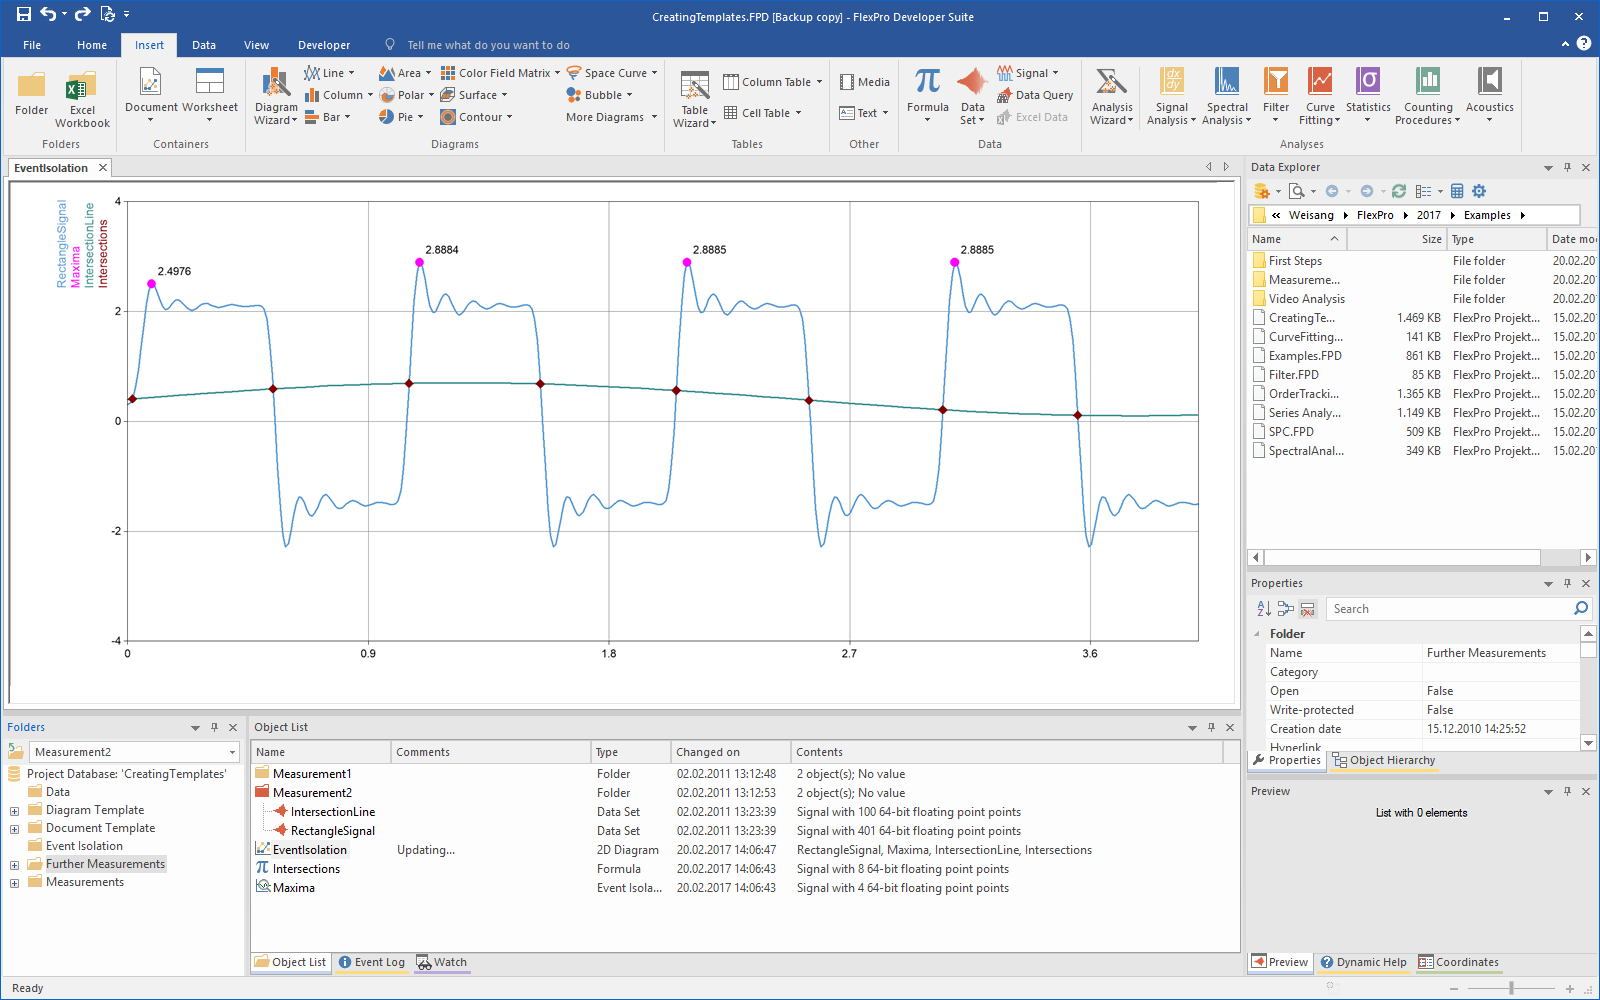
The following example shows how you can logically combine several events in sequential order. The event isolation object searches for all local maxima that follow a slope through the zero point of the signal.
Creating an Analysis Template
1.Select the Event Isolation and select Home[Selected Objects] > Save As Template.
Note: If you save a folder as a template, then all objects in the folder are saved as a template. Alternatively, you could also double-click to open the folder, select all objects inside, and then run the Save as Template command.
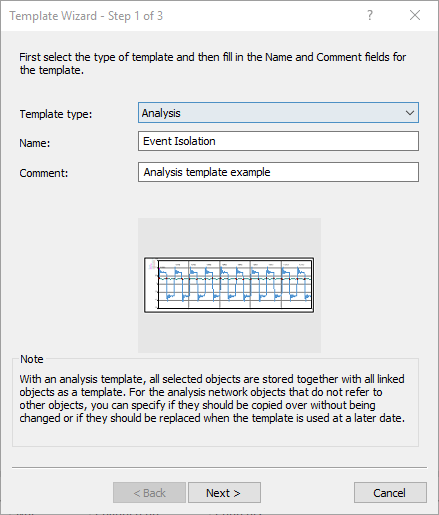
2.The Template Wizard opens. FlexPro automatically selects the Analysis template type, since a folder or multiple objects were already selected. The name of the selected folder is used as the template name, and the folder comments are used as the template comments. Do not change the template type or name of the templates. In the Comment field, enter Analysis template example. Now click Next.
3.Now all objects of the lowest hierarchical level, which are objects that do not refer to other objects, are listed. The objects highlighted are replaced by selected objects (such as data sets) when a template is loaded. All other objects are copied over without being changed. Do not change the selection for the Signal and IntersectionLine objects.

4.In the Used as column, you can change the text that is displayed when the template is used. For the Signal object, enter the text Signal to evaluate and for the IntersectionLine object, enter Intersection line. Click Next.
5.Here you can specify the template database in which the new template will be stored. Save the template under Personal template database. Now click Finish.
Using the Analysis Template
1.In the Object List or in the Folders window, open the folder called Data. Select the data sets called Threshold and RectangleSignal.
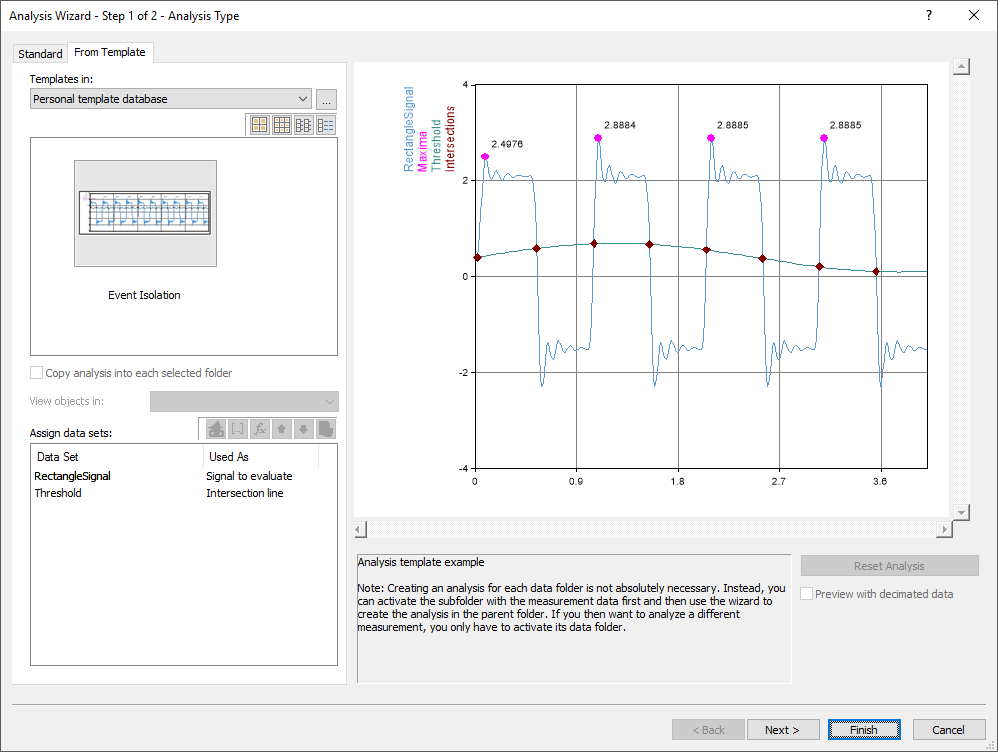
2.Now choose Insert[Analyses] > Analysis Wizard > From Template. The Analysis Wizard opens.
3.Under Templates in select the entry Personal template database and select the template called Event Isolation.
4.Check the assigned data sets for correctness. The RectangleSignal is the signal to evaluate and the Threshold signal is the intersection line.
Note: Using the names and contents of the selected data sets as a guide, the wizard tries to assign them correctly for the selected analysis. If it is unsuccessful, the objects are assigned as displayed in the Object List.
5.You can correct the assignment of data sets by selecting a line in the list and using the arrows to move the data set up or down. Update the preview by clicking on the Update icon. This lets you verify if the data is assigned correctly.
6.To create the analysis in the Data folder, click Finish.
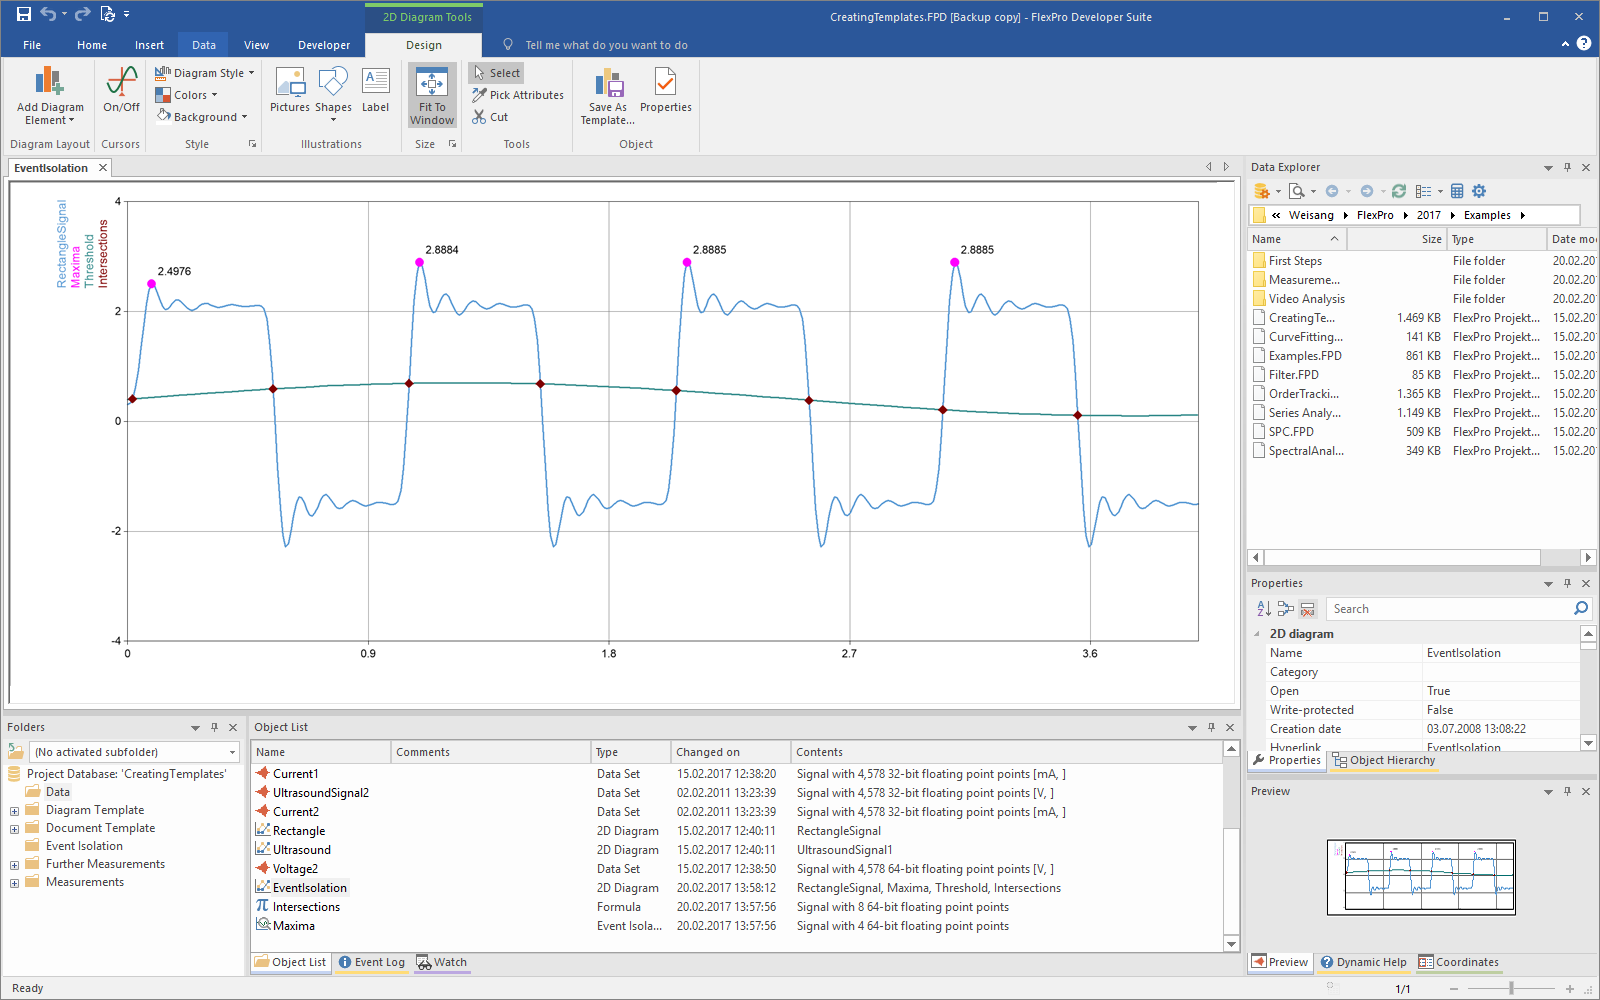
7.Now double-click to display the 2D diagram EventIsolation in the workspace.
Creating an analysis in each measurement folder
1.In the Object List or in the Folders window, open the Measurements folder and select the folders Measurement1 and Measurement2.
2.Now choose Insert[Analyses] > Analysis Wizard > From Template.
3.Confirm the Select List Elements dialog boxes by clicking OK.
4.Now under Templates in select Personal template database and select the template called Event Isolation.
5.Check that the assigned data sets are correct
6.To create the analysis in the Measurement1 and Measurement2 folders, make sure that the option Copy analysis in each selected folder is enabled.
7.Click Finish.
Note: You can use an analysis simultaneously on multiple subfolders only if the selected folders contain the same objects (object names are the same). Copying a template in each selected folder is, however, not absolutely necessary. Instead, you can activate the subfolder with the measurement data first and then use the wizard to copy the template to the parent folder. If you then want to analyze a different measurement, you only have to activate its data folder. See also Analyzing Multiple Measurements.
Using an Analysis Template for Multiple Measurements
1.In the Object List or in the Folders window, open the folder called Further Measurements.

2.Select the folder Measurement1 from the Activate Subfolder list box at the top of the Folders window. Alternatively, you can right-click with your mouse on the folder Measurement1 and select the command Activate Folder from the context menu.
3.In the Measurement1 folder, select the data sets called IntersectionLine and RectangleSignal.
4.Now choose Insert[Analyses] > Analysis Wizard > From Template. The Analysis Wizard opens.
5.Now under Templates in select the entry Personal template database and select the template called Event Isolation.
6.Check that the assigned data sets are correct here as well.
7.Click Finish.
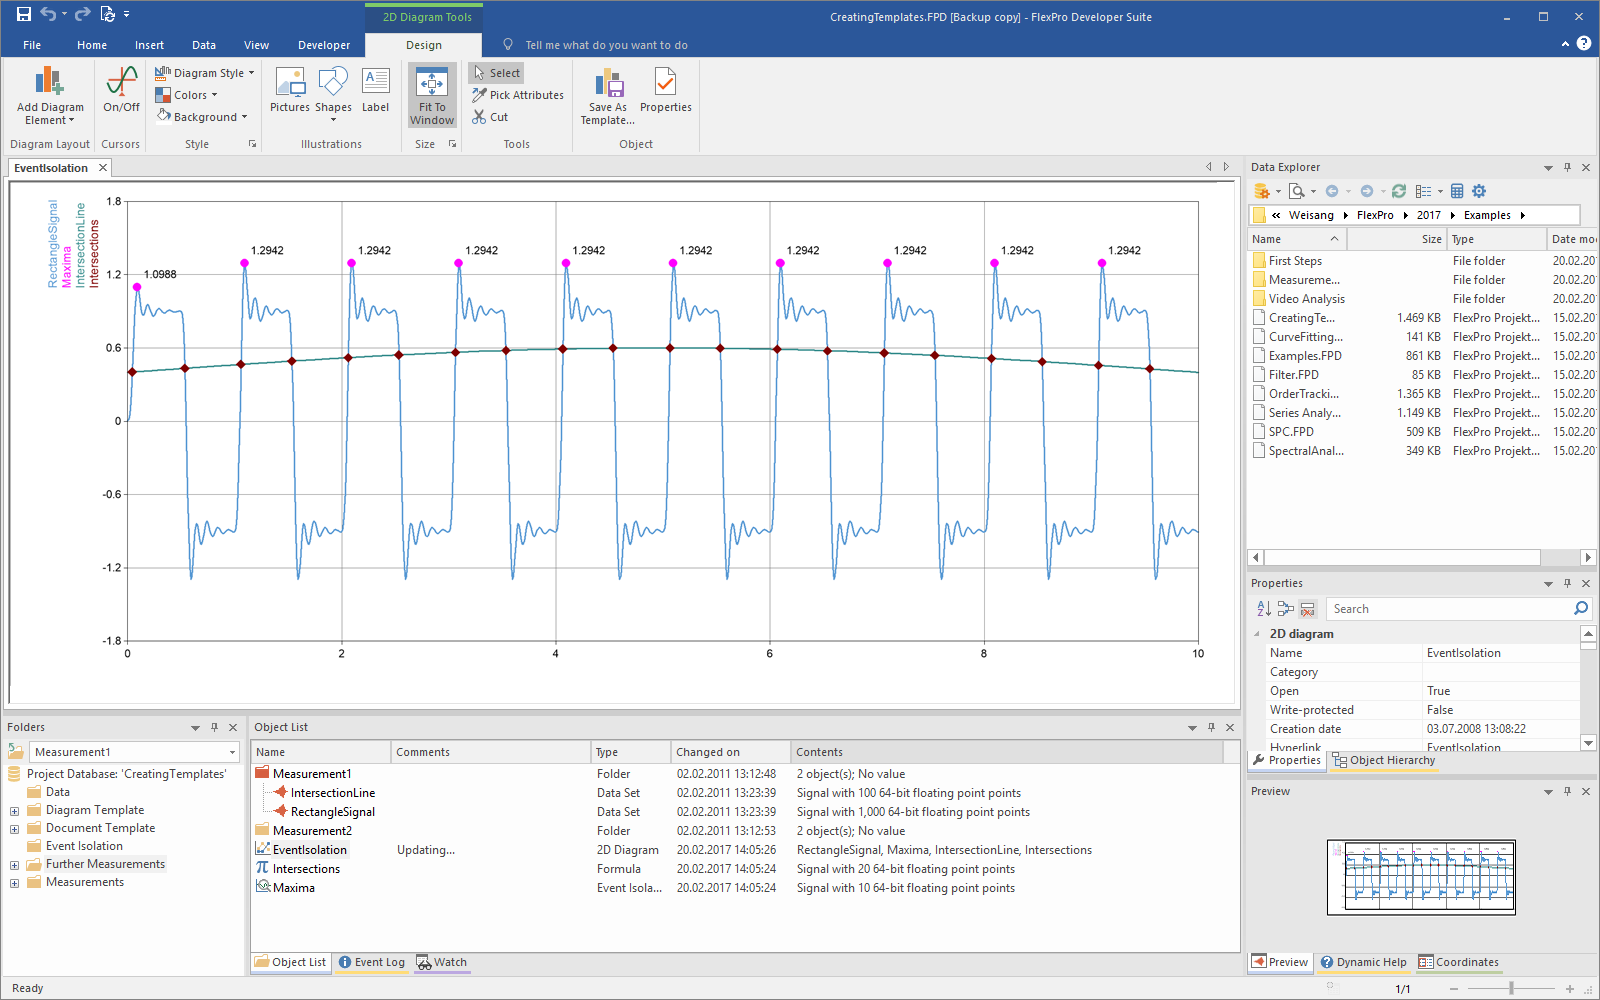
8.Now double-click to display the 2D diagram Eventisolation in the workspace. The analysis of the activated Measurement1 is displayed to you.
9.To view the analysis of the Measurement2 folder, activate the Measurement2 folder.
Document Templates
As opposed to analysis templates, each document template always contains only one document. It is therefore the document's direct links and not the objects at the lowest hierarchical level that are replaced by selected objects. These are all objects that are one level lower than the document in the object hierarchy. If the document contains a 2D diagram as a link, for instance, when the template is loaded, the 2D diagram is replaced by a selected 2D diagram. If the document contains an embedded 2D diagram with a signal as a curve, the signal is replaced by a selected object.
Creating a Document Template
1.In the Object List or in the Folders window, open the folder called Document Template.
2.Right-click with your mouse on Document and then select Save As Template from the context menu. The Template Wizard opens.
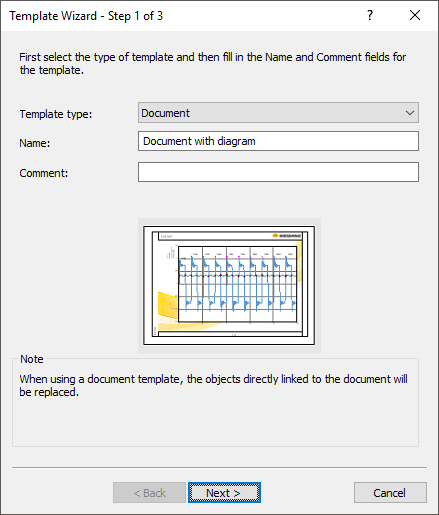
3.For the Template type, select Document and for the Name enter Document with diagram. Click Next.

4.In the Used as column you can change the text that is displayed when the template is used. For the EventIsolation object, enter the text Diagram. Click Next.
5.Go to the last page of the wizard. Save the template under Personal template database. Click Finish.
Using a Document Template
1.In the Object List or in the Folders window, open the folder called Data. Select the diagram called Rectangle.
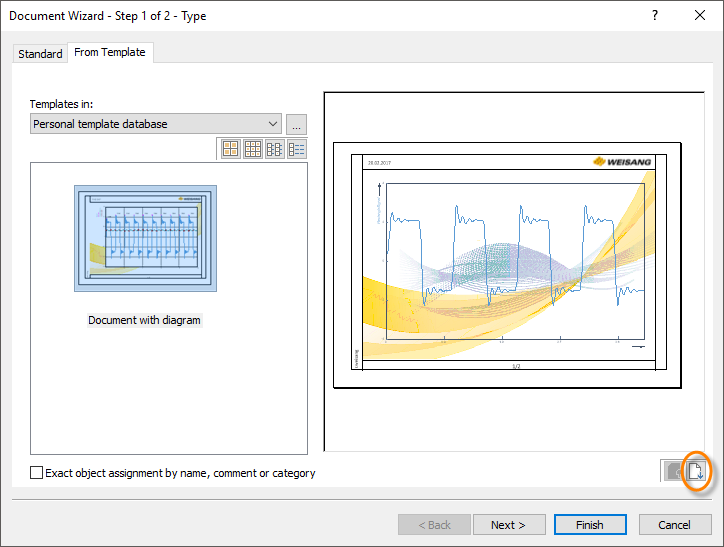
2.Now choose Insert[Containers] > Document > From Template. The Document Wizard opens.
3.Next, under Templates in select Personal template database and select the template called Document with one diagram. The wizard automatically creates a document. Click Next.
4.Here you have the option of adding or deleting pages. Click Finish.
5.Select the diagrams called Ultrasound and Rectangle. Now select the same template again.
6.The Document Wizard now automatically creates a multi-page document. The document preview is used to display the individual pages of the document. Use the arrow keys below and to the right of the preview to switch between the individual pages of the document. Now click Finish.
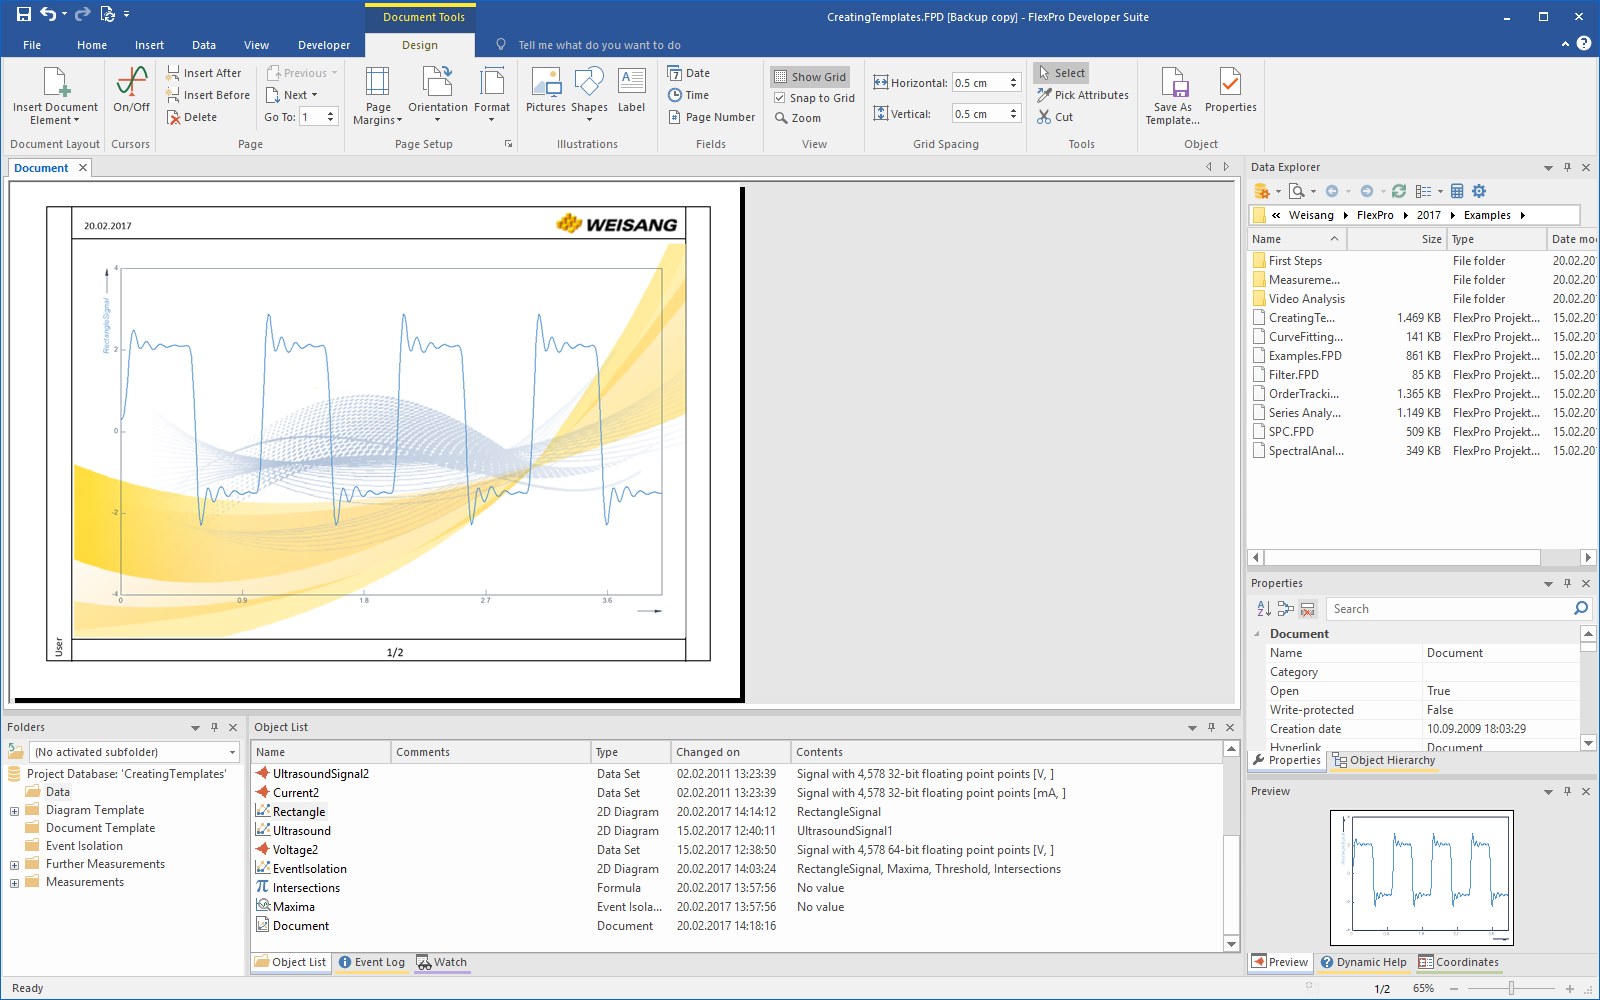

7.Use the mouse wheel to switch between the individual pages of the document in the FlexPro workspace.
Diagram template
FlexPro makes a distinction between static and dynamic diagram templates. If you use a dynamic template, then a curve is created for each selected data set. In a static template, only the existing curves are linked to the selected data objects. Excess data objects, if present, are ignored. You define the type of template when saving it.
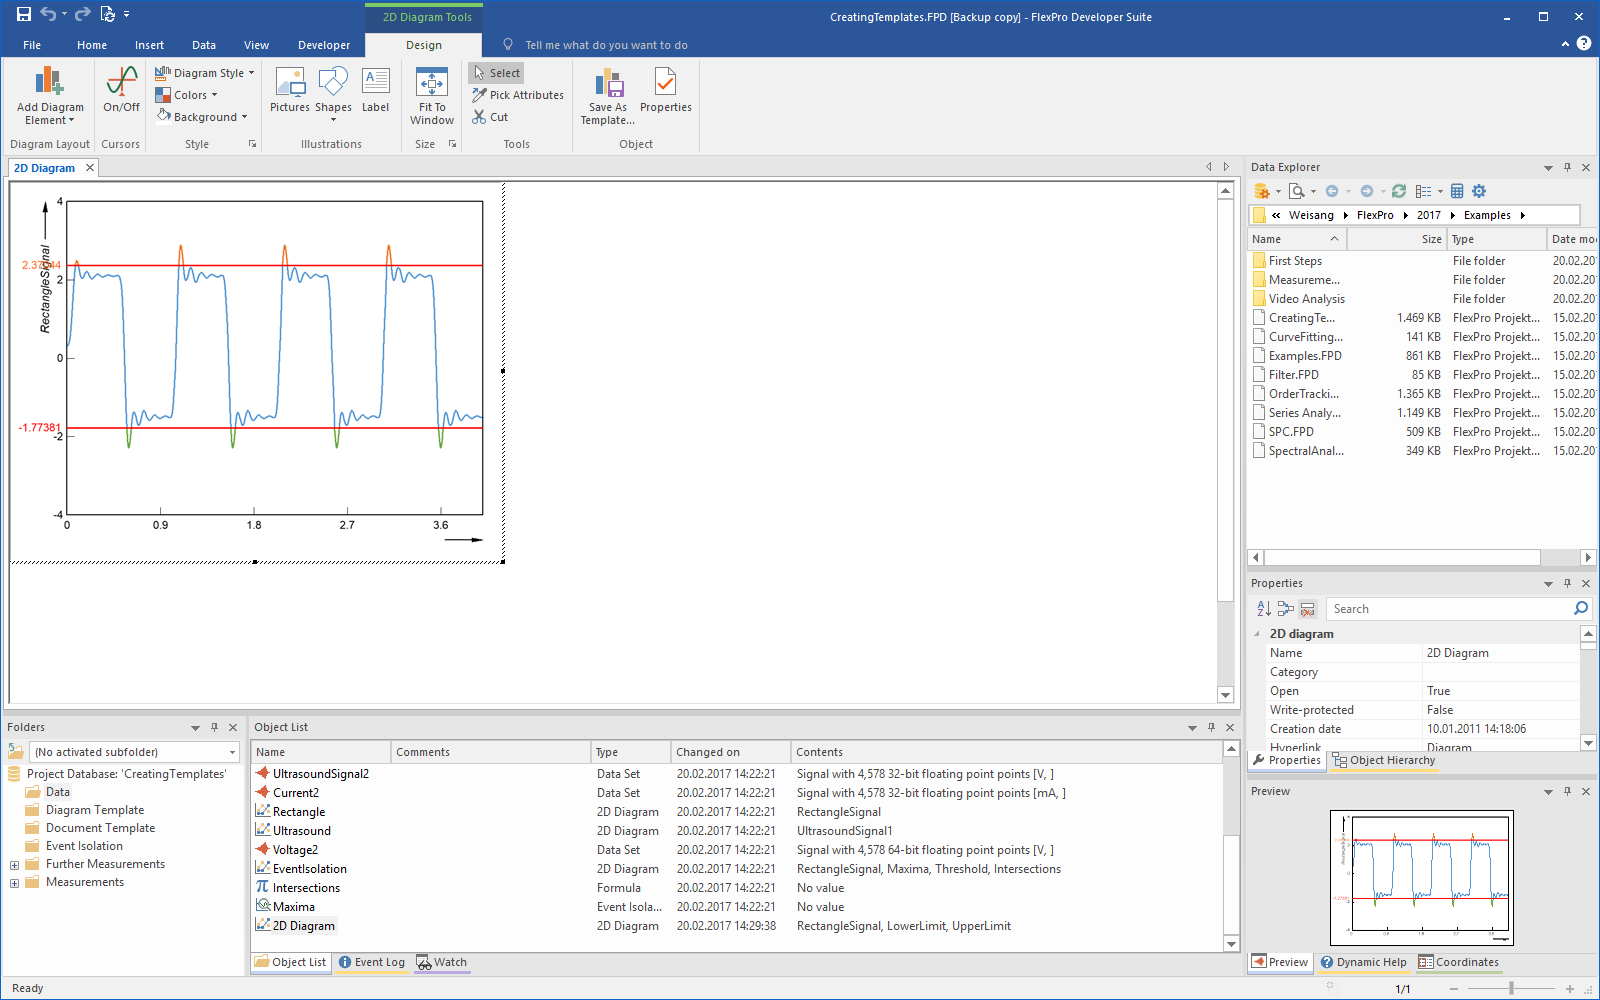
Creating a static diagram template
1.Open the folder called Diagram Template.
2.Select the 2D diagram called Diagram and then click Home[Selected Objects] > Save As Template. The Template Wizard opens.

3.For the Template type, select Diagram and for the Name enter Upper and lower limit. Disable the option Save as dynamic template with a variable number of curves. Click Next.

4.In the Used as column you can change the text that is displayed when the template is used. For the UpperLimit object enter the text Upper limit, for the Signal object enter Signal and for the LowerLimit object enter Lower limit. Now click Next.
5.Save the template under Personal template database. Click Finish.
Using a Static Diagram Template
1.In the Data folder, select the objects RectangleSignal, UpperLimit and LowerLimit and then select Insert[Diagram] > Diagram Wizard > From Template.
2.Under Personal template database select the template called Upper and lower limit. Click Finish.
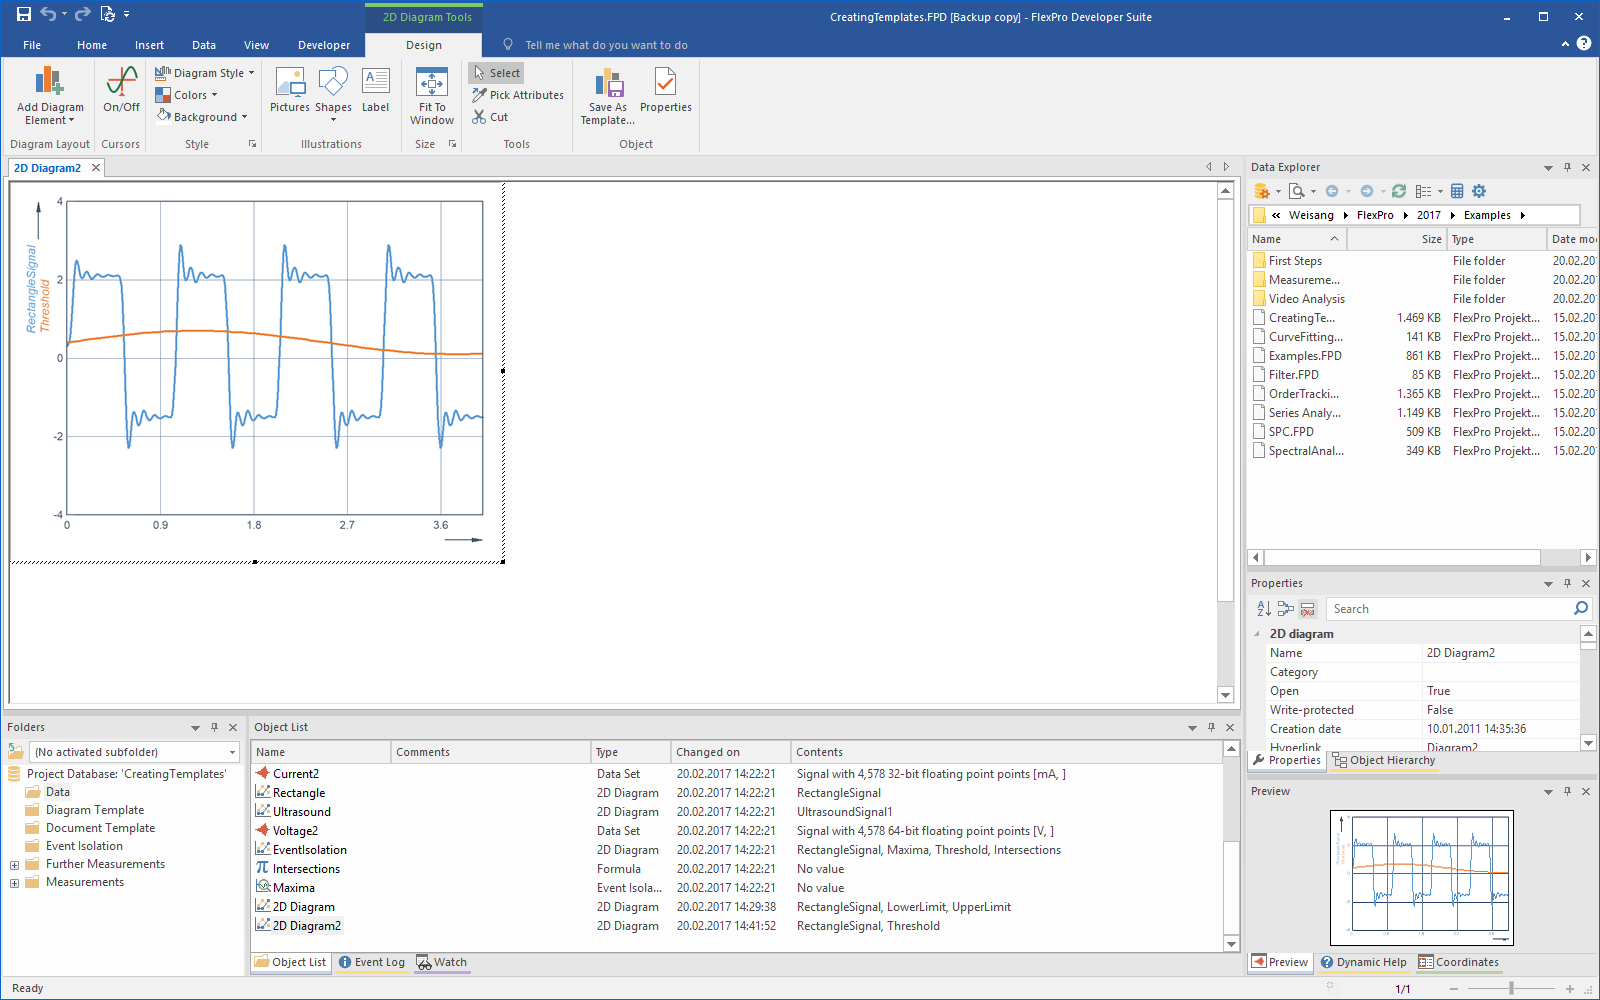
Creating a Dynamic Diagram Template
1.Open the folder called Diagram Template.
2.Select the 2D diagram called Diagram2 and then click Home[Selected Objects] > Save As Template. The Template Wizard opens.

3.For the Template type, choose Diagram and then enter Diagram template as the name. For the Comment enter the text Diagram template with 2 curves.
4.Enable the option Save as dynamic template with a variable number of curves. Click Next.

5.For the Signal object enter Signal and for the Signal2 object enter Signal 2. Click Next.
6.Save the template under Personal template database. Click Finish.
Using a Dynamic Diagram Template
1.In the Data folder select the object called RectangleSignal and then select Insert[Diagram] > Diagram Wizard > From Template.
2.Under Personal template database select the template called Diagram template. Now click Next.
3.Add a curve [1] and select Template2 for the style [2].

4.In the Assign objects field, create the object links required by the selected template. Assign the data set called Threshold to the object reference [3]. Update the preview by clicking on the Update icon [4]. Click Finish.
Note: The styles correspond to the designs of the curves contained in the diagram template. By assigning a format template to a curve, you are defining its appearance, such as its color, line style and fill style.
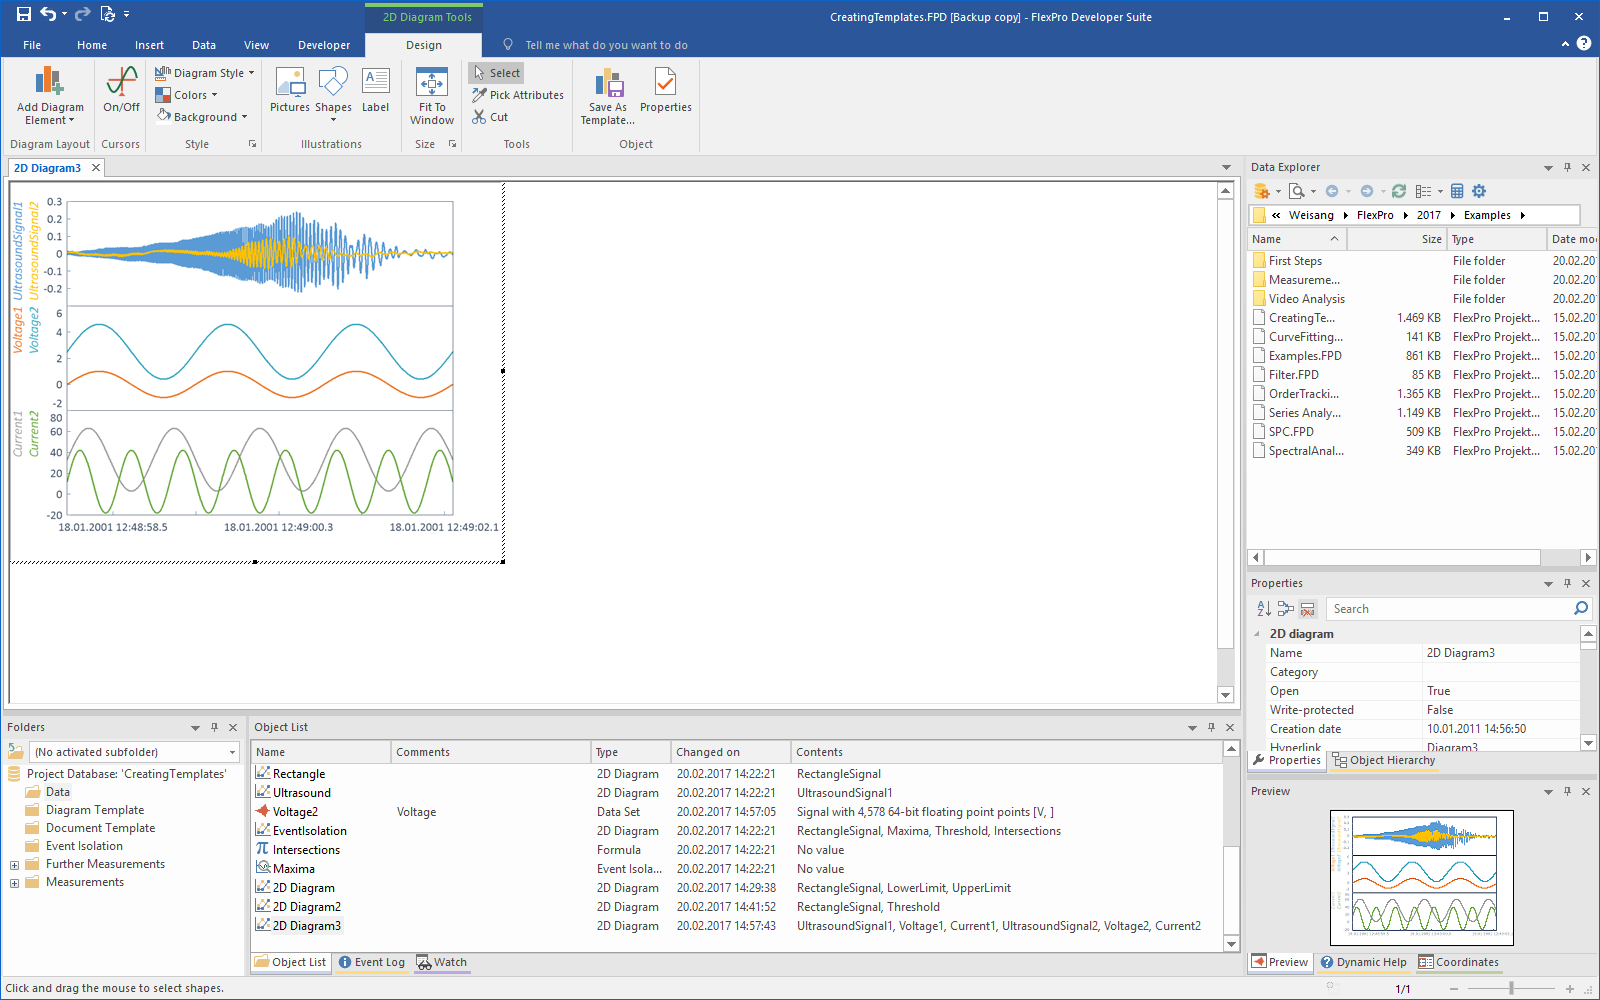
Dynamic diagram template with multiple curves
This example illustrates how you can automatically assign a particular format template to the selected data sets when loading a diagram template. The line diagram in this example contains three stacked axes, each with a curve. The aim is to assign all current signals to a first axis, all voltage signals to a second axis and all ultrasound signals to a third axis.
Creating a Dynamic Diagram Template
1.Open the folder called Diagram Template.
2.Select the 2D diagram called Diagram3 and then click Home[Selected Objects] > Save As Template. The Template Wizard opens.
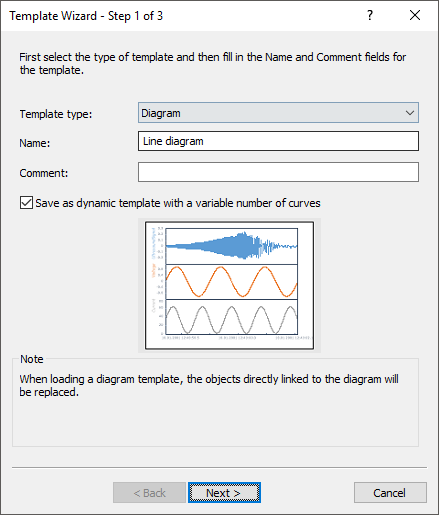
3.For the Template type, select Diagram and enter Line diagram as the Name.
4.Enable the option Save as dynamic template with a variable number of curves. Click Next.
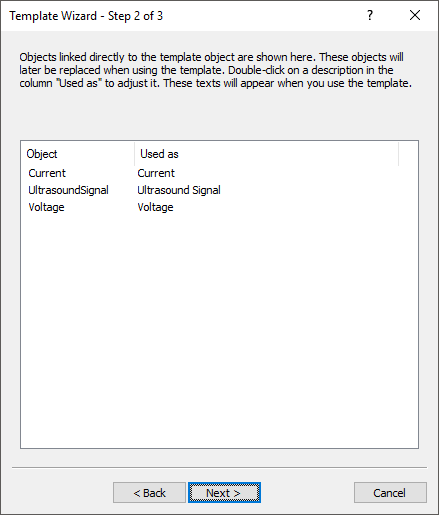
5.For the Voltage enter the text Voltage, for the Current the text Current and for the UltrasoundSignal the text Ultrasound Signal. Click Next.
6.Save the template under Personal template database. Click Finish.
Loading a Dynamic Diagram Template
1.In the Data folder, select the objects Voltage1, Voltage2, Current1, Current2, UltrasoundSignal1 and UltrasoundSignal2 and then select Insert[Diagram] -> Diagram Wizard > From Template.
2.Under Personal template database select the line diagram template. Enable the option Exact object assignment by name, comment or category. A diagram with three axes is automatically created. All ultrasound signals are assigned to the first axis, all voltage signals are assigned to the second axis and all current signals are assigned to the third axis.
3.Click Finish.
Note: The correct assignment is then possible when the entries Used as of the object references (Current, Voltage or Ultrasound Signal) match the comments or category of the selected objects. If they are not identical, the selected objects are assigned randomly to the existing format templates, as long as the option Exact object assignment by name, comment or category is disabled.