3D Curve Types and Display Formats
As opposed to a 2D diagram, the following curve types differ for a 3D diagram:
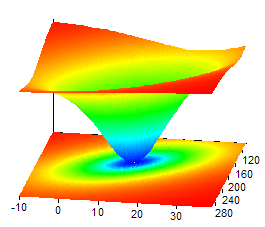
This type of curve displays the data as a surface defined by data points arranged in a grid. Space curves (scatter data or XYZ data) are automatically converted to a signal series (data grid) before display. The conversion takes place either through resorting or through "natural neighbor" interpolation. The surface can be smoothed, if necessary. For the "resort" algorithm, smoothing takes place later using bicubic splines. You can adjust all of the curve settings on the Data tab. You obtain a contour diagram by setting the diagram's angles of rotation and inclination so that the result is a plan view.
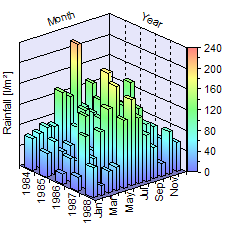
You can display signal series (with a Z component, if applicable) or data matrices in a 3D column chart. A column chart can also be a combination of several data series or signals with identical X components.
You can specify a fixed width of 1 to 100 percent of the spacing between neighboring columns for the column width, defining the minimum distance in the X and Z direction to 100 percent. The spike chart means that columns are drawn as "needles", using the attributes from the Fill tab as the base. The border lines are omitted in this case.
When selecting Color field matrix in the Diagram Wizard, the result is a 3D column in plan view with a color shading or color palette in the Y direction.
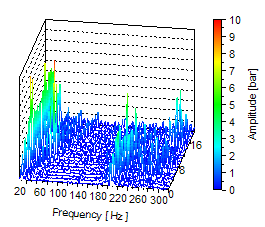
In a waterfall chart you can display signal series (possibly with a Z component and two-dimensional X component), data matrices or space curves. A waterfall diagram can also be put together from several data series or signals. Space curves are converted automatically to a signal series before being displayed by resorting using the CurveToSurface function. You can change the tolerance for the conversion on the Data tab of the curve in the diagram.
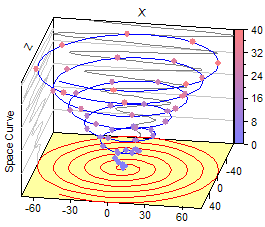
In a space curve chart, you can display data sets of the space curve data structure or three data series, which combine to form a space curve.
Usually, a 3D diagram only uses one curve from one of the four types. In some cases, however, it makes sense to use several curves, for instance, to label individual points in a contour chart.
Display Formats
The following display formats can be used within a single type of curve:
To reinforce the impression of space, the borders of the three-dimensional columns can be highlighted with lines. These border lines are particularly important when no lighting source is used. Typical line attributes can also be applied to border lines.
You can use grid lines to display the surface as a grid. Neighboring points are joined up by lines whose style and color you can set. It is possible to use a color palette in the Y direction. In addition to this, you can project the grid onto the coordinate system planes.
If you do not use any filling for the surface, you can also make the grid lines visible, although these are not visible from the viewing angle set.
If the data set contains void values, then all of the connection lines to these values are omitted, causing gaps in the grid network.
•Connection Line (Space Curve, Waterfall)
This display format connects a curve's adjacent points with a line for which you can adjust the style and color. For the waterfall chart, you can use a color palette in the Y or Z direction or linear or spectral color gradient in the Y direction. The space curve can be colored using a color palette in any direction.
If the data set contains invalid values, you can specify whether these are to be bridged with a line or whether a gap in the curve is to be shown.
The connection line for the waterfall chart can also be drawn as a step line, especially for displaying digital signals. You can freely choose the location of the vertical edge between neighboring points.
•Symbols (Surface, Space Curve, Waterfall)
This display format draws a small symbol, e.g. a rhombus or a circle, at each point of the curve. You can freely set symbol shape, size and color.
•Data Labeling (Surface, Space Curve, Waterfall)
The "Data Labeling" display format shows text with the value of the X, Y or Z coordinate of the point for each point on the curve. You can also use data from additional data sets for data labeling.
•Fill (Surface, Waterfall, 3D Columns)
This display format fills the surface, the area under each curve of a waterfall chart, or 3D column walls with a solid color, linear color gradient or a color spectrum. Alternatively, you can specify a palette with fill colors that can be used for the surface in the Y direction, for the waterfall chart in the Z direction, and for the columns in any direction. If desired, you can also project the filling of a surface onto the planes of the coordinates system.
If you use a color palette in the Y direction or one of the color shadings, you can switch on a color legend and thus visualize the color change regardless of the viewing angle of the 3D diagram. The coloring also depends on the lighting settings on the 3D diagram's 3D View .
These are intersection lines between the surface and planes, which are parallel to one of the three planes of the axis system. Contour lines emphasize the contour of a surface and can be drawn for any direction. The intersection planes can be specified by the divisions of the corresponding axis or by a freely selectable data set. The contour lines can also be optionally projected onto the corresponding plane of the coordinates system. You can also have a label with the value assigned to the contour line.
This display format projects the space curve onto the planes of the coordinates system. You can freely set the line attributes of the projection.
This display format allows you to draw perpendicular lines from the points of the curve onto the planes of the coordinates system. You can freely set the line attributes for the perpendicular lines.