Column, Row and Cell Tables
You can use these presentation objects to display data in table form. You can use the Table Wizard to create column, row and cell tables, which offers an assortment of templates.
Column Table
The column table consists of one or more columns. One data set can be assigned to each column, supplying all of the data for this column. Therefore, the column table is particularly suited for displaying data sets containing more than one value, i.e. data series, data matrices, signals or signal series. A typical example would be a data series with the local maxima of a signal. Every column has one column title where fields for the name and unit of the data set can be inserted. Due to this structure, the behavior of the column table is particularly dynamic. The number of values supplied by a data set for a column may vary. The number of rows in the table then changes automatically. You can even display a list containing several data sets. In this case the number of table columns automatically adjusts to the number of data sets in the list.
The column table supports a variety of design options, such as any writing direction, alignment of numbers to the decimal point, and wrapping of longer strings.
The following figure shows a column table with an index column, a column with a data series and a column with a data matrix. A column index is also added to the last one.
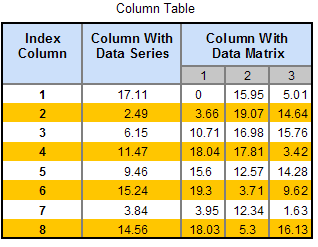
Data Columns, Index Column and Column Index
In the column table you can display all data structures supported by FlexPro except for signal series with two-dimensional X components. Aggregate data structures are displayed in several columns. For example, if you add a signal, two columns are displayed side by side in the column table: one column with the X component of the signal and one column with the Y component of the signal. All data types are permitted, particularly including complex numbers and strings.
If a column represents a data matrix or signal series, then this column is divided into several sub-columns, one for each data series in the (Y) data matrix. The Z component of a signal series is displayed as a column index under the column title.
In addition to the data columns, an index column can be added to the column table, and you can use this column to number the rows in the table. You can give the complete table a text label that you can position above or below it.
Unit
You can specify an output unit for each data column. The corresponding data is then converted to this unit before output. If you do not specify an output unit, the data is output in the unit in which it occurs.
Multi-Page Column Tables
If you display column tables in the object window or insert them into FlexPro documents, these column tables can be wrapped across several pages in the document. Wrapping occurs automatically if not all columns of the table fit next to each other or if not all data rows of the columns to be displayed fit on one page.
When wrapping due to too many columns, you can specify that all columns should be displayed on the same page. The subsequent columns will then be displayed further down on the same page, but this means that fewer rows can be displayed.
When wrapping due to too many data rows, FlexPro first tries to wrap the column on the same page, and the number of columns in the table is multiplied. The column table is not continued on the next page until all of the space on the first page is fully occupied. The titles appear on every page.
Note: This wrapping option is only available for displaying in the object window and in FlexPro documents. If you export the column table as an OLE object, only the first page is displayed.
Row Table
The row table is particularly suitable for displaying scalar values, such as measurement parameters or statistical results. Using the Orientation attribute, you can convert a column table into a row table and vice versa. The table is then essentially mirrored on the diagonal, i.e. columns become rows and vice versa. The same design options are available for the row table as for the column table.
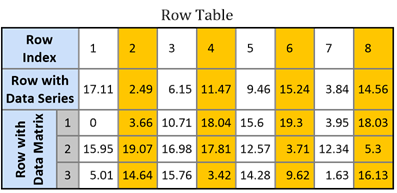
The following row table corresponds to the column table above. In addition to the orientation, only the writing direction for the title of the data matrix has been changed.
Multi-Page Row Tables
If you display row tables in the object window or insert them into FlexPro documents, these tables can be wrapped across several pages in the document. Wrapping is done automatically if not all rows of the table fit under each other or if not all data columns of the rows to be displayed fit on one page.
When wrapping due to too many rows, you can specify that all rows should be displayed on the same page. The subsequent rows will then be displayed further down on the same page, but this means that fewer columns can be displayed.
When wrapping due to too many data columns, FlexPro first tries to wrap the row on the same page, and the number of rows in the table is multiplied. The row table is not continued on the next page until all of the space on the first page is fully occupied. The titles appear on every page.
Note: This wrapping option is only available for displaying in the object window and in FlexPro documents. If you export the row table as an OLE object, only the first page is displayed.
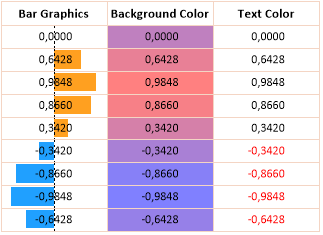
Conditional Formatting
Usually the color of the table cells comes from the color scheme selected for the table. However, you can also use conditional formatting to visualize the relative quantity of the values displayed. For instance, display a small bar after the numerical value or vary the color of the cell background and/or cell text.
Cell Table
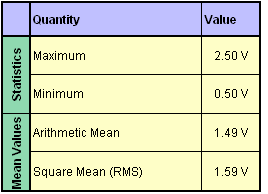
The cell table is made up of several cells arranged as columns and rows. Each cell may contain an individual text where you can embed fields for calculation results. The cell table corresponds to the tables you might already be familiar with from your word processor.
The following illustration shows a typical cell table:
Working with Tables
Creating a Column or Cell Table
Changing Table Style and Table Color
Conditional Formatting of a Column or Cell Table
Adding or Deleting Dividing Lines and Frames
Changing the Color of Dividing Lines, Frames, Text and the Background
Changing the Padding Between Text and Cell Borders
Text Wrapping for the Column Title or Cell Text
Working with Column Tables
Changing the Height of the Rows and Column Titles
Changing Page Splitting in a Column Table
Navigating Multi-Page Column Tables
Enabling/Disabling the List View with Alternating Colors
Changing the Data Format in a Column Table
Displaying the Unit Symbol after the Data Values
Adding or Deleting a Column Title
Displaying Data Set Information in the Column Title
Adding or Deleting a Column or Row Index
Working with Row Tables
Changing the Width of Columns in Row Titles
Changing Page Splitting in a Row Table
Navigating Multi-Page Row Tables
Enabling/Disabling the List View with Alternating Colors
Changing the Data Format in a Row Table
Displaying the Unit Symbol after the Data Values
Adding or Deleting a Row Title
Displaying Data Set Information in the Row Title
Adding or Deleting a Column or Row Index
Working with Cell Tables
Specifying the Output Unit of Data in a Cell
You might be interested in these articles
You are currently viewing a placeholder content from Facebook. To access the actual content, click the button below. Please note that doing so will share data with third-party providers.
More InformationYou need to load content from reCAPTCHA to submit the form. Please note that doing so will share data with third-party providers.
More InformationYou are currently viewing a placeholder content from Instagram. To access the actual content, click the button below. Please note that doing so will share data with third-party providers.
More InformationYou are currently viewing a placeholder content from X. To access the actual content, click the button below. Please note that doing so will share data with third-party providers.
More Information