Analyzing Data with Cursors
FlexPro allows you to measure curves in 2D and 3D diagrams and videos using cursors.
More specifically, the following options are available:
•Show one or two cursors using different display formats.
•Free and bound cursors.
•Harmonic cursors for measuring secondary harmonics in spectra.
•Sideband cursors for measuring sidebands in spectra.
•Order tracking cursor for measuring orders in speed-frequency spectra and frequencies in order spectra of machine ramp-ups.
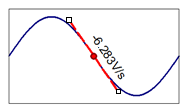
•Slope cursor for measuring the slope of the curve.
•Show values under the cursors, their differences and custom coordinates.
•Zoom in on or out of curves and scroll through them.
•Move to individual frames in videos.
•Animate a cursor to play back curves.
•Translate curves in 2D diagrams.
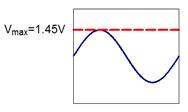
•Navigate to peak values.
•Select individual points or ranges of one or more curves.
•Edit the values under the cursors.
•Remove outliers from curves.
•Form new data sets from sections of curves.
•Dimension curves.
You can use the cursors in 2D and 3D diagrams, in media, in documents and in worksheets. If you use the cursors in a worksheet or document, you can simultaneously measure multiple diagrams and analyze videos that you have recorded synchronously with physical quantities. However, the worksheet is generally better suited than the document as an environment for using the cursors, because it takes better advantage of the screen. While the cursors in the worksheet are always active, you first have to activate them in the diagram, media or document.
Cursor Types
You can use one or two cursors for each diagram. The leading cursor is displayed as a solid line and is used to measure curves. The origin cursor is shown as a dashed line. It specifies the origin for the calculating differences.
FlexPro offers you free and bound cursors. You can move a free cursor anywhere on the plane of the diagram, while a linked cursor always follows the points of the curve. Free cursors are particularly suitable for measuring parts of the curve where there are no points or for measuring distances to a free reference position. You individual curves of a diagram from cursoring. The cursor can then no longer be positioned on the curves, and their values are not displayed in the coordinates window.
You can display the cursors as a vertical line or as a cross-hair. You can also move the cross-hair cursor vertically with your mouse.
Media objects support only a cursor that represents the time of the currently displayed frame. Use the horizontal scrollbar so you can move to an image and thus move the cursor.
In addition to the main cursor, you can activate one of the following auxiliary cursors:
Harmonic Cursors
FlexPro offers you harmonic cursors that are specifically designed for measuring secondary harmonics in relation to a primary harmonic in spectral signals. If you activate this option, in addition to the active cursor, additional cursors are displayed, which are positioned at multiples of the current X cursor position. You can specify the spacing between harmonic cursors in octaves, where one octave corresponds to a factor of two.
Sideband Cursors
These are also suitable for evaluating spectra. The sideband cursors appear at a fixed distance to the left and right of the current X cursor position. You can easily adjust the spacing of the sideband cursors with the mouse by moving a sideband cursor.
Order Tracking Cursor
Speed-frequency spectra or order spectra are often used to evaluate machine ramp-ups. The speed determines the basic frequency of the machine. Since parts of the machine usually rotate at multiples of the speed, amplitudes also appear in the spectrum at these multiples, which are called orders. The order tracking cursor appears in the speed-frequency spectrum as a diagonal line and marks locations of the same order. In order spectra, it appears as a hyperbola and marks locations of the same frequency.
Slope Cursor
The slope cursor appears as a tangent to the curve and is used to measure the slope of the curve.
Cursor Synchronization
If you use the cursors in a worksheet or document with multiple diagrams and/or videos, FlexPro can synchronize the cursors between the individual objects. Synchronization can be carried out via the X index, i.e. via the number of the active value in the curve or frame in the video. Alternatively, FlexPro can synchronize the cursors via the X value. In a video, this is the time corresponding to the displayed frame; in a curve, this is the X value of the active point.
FlexPro can also synchronize the cursors while you play a video or audio signal. In this case, the cursors in the diagrams are animated and move in sync with the video or audio signal over the curves. Conversely, you can move a cursor in a diagram to display the relevant frame in the video, e.g. for a position at which you identified a point of interest in a measurement signal.
Zooming and Scrolling
You can zoom into any section of the diagram's plane or show the area between the two cursors as spread out in order to take a closer look at interesting signal segments. All processes that change the section displayed in the diagram achieve this by manipulating the axis scale end values in the diagram. In addition, automatic scaling on the axis concerned is disabled. This modification takes place directly on the axis in the diagram concerned. If you edit a linked diagram with cursors, zooming therefore affects all documents where you have inserted a link to the diagram. You can undo any step in the process of zooming and scrolling or restore the diagram to its original state. If you move the cursor on a curve you have zoomed into, it might leave the visible section. In this case, you can determine whether the image section should be automatically expanded or moved.
Animating a Cursor
You can animate any cursor, which means you can let it run automatically over a curve. If the curve under the cursor is a time signal, the animation takes place in real-time or at a multiple rate of this speed. When viewing an image you have zoomed into, the section of the image may be automatically expanded or moved when the cursor leaves it. The signal then scrolls across the screen.
Markers
When measuring curves, you can select individual points or ranges, for instance, to highlight prominent points in the curve. When setting a marker, you can determine whether the marker is to be displayed in the current view of the diagram or in all views that display the diagram. FlexPro offers you a variety of templates for markers that you can use to mark not only data points, but also slopes, waypoints, orders and frequencies. Of the marker has a text box, it can be placed either on the edge of the diagram or directly on the marked point. In the text box you can display any text in which you can embed the coordinates of the selected points or, for example, the slope using fields.
Use a multi-marker to select all curves at a specific X position in one step. If you place the marker field of the multi-marker at the diagram edge, the coordinates of all curves are combined in one field.
You can mark a curve range, the area under a curve range, or the rectangular range of a surface with a range marker. This highlights a section of a curve or surface in color.
An image marker places an image at the highlighted position. If you have recorded videos synchronously with measurement data, FlexPro can automatically take a still image for the highlighted X position from an assigned media and use it for the image marker. Alternatively, you can specify an image file from which the image is to be imported. If you use a chart with map display and add an image as an image marker in which the longitude and latitude of the recording are stored, then you can decide whether the image marker should be positioned at this location instead of the current cursor position.
FlexPro offers a variety of marker templates to choose from with attributes that are stored in the FlexPro user profile. Each of the above marker types is also available as a custom marker that you can design freely. The attributes of the custom markers are stored in the diagram where you use the markers.
However, after you have set a marker, you can always edit or reposition it. FlexPro takes design attributes that you set to Automatic from the user-defined template in the diagram. The attributes of the template thus apply to all marks for which you do not make individual settings.
You can store the marker positions as a data set or formula in the project database, which you can access in your analyses.
Changing Data Set Values
If the curve where the cursor is located obtains its data from a data set, then you can manipulate its values directly using the cursors. The cursors offer you the option of changing a single value or the range between the cursors to a different value, interpolating them or setting them to void. The first option is ideal for the visual adjustment of a calibration characteristic curve, for instance, and the two others are good for removing outliers from the data set. Setting outliers to void is generally preferred over interpolation, since in this case no false data is being introduced. However, the advantage of interpolation is that the resulting data cannot contain void values, and thus calculations can still be made using algorithms, such as the Fourier transform.
Translating Curves
You can translate the curves of 2D diagrams using the cursor, e.g. to compensate for time lag when measuring. In this case, the curves are only visually translated. The base data remains unchanged. The offset is entered as Y offset and X offset on the Data tab of the curve.
Coordinates Window
In the coordinates window, the coordinates of the cursors and their differences are displayed. To do this, you can specify whether only the coordinates of the active diagram or the coordinates of all diagrams in a document or worksheet are to be displayed. You can copy the contents of the coordinates window to the clipboard as a static picture or into a diagram, document or worksheet as a dynamic object. In addition to the coordinates window, FlexPro displays an information window with the scaled coordinates of the current mouse pointer position if you move the pointer over the diagram.
You have two options available for customizing the coordinates window. Instead of displaying the predefined coordinates, you can display any presentation object in the coordinates window, such as a table with custom results related to the cursors. FlexPro updates this object automatically whenever cursors are moved. The second option is to extend the coordinates window to include custom coordinates. These are special FPScript formulas that access the cursors and perform particular calculations, such as finding the area under the curve between the two cursors. FlexPro provides you with several predefined coordinates. However, you can also program your own coordinates in FPScript.
Dimensioning curves
FlexPro offers you a variety of dimensioning elements that you can use to dimension the curves of diagrams:
Dimensioning |
Description |
|---|---|
Boundary Line |
A horizontal or vertical boundary line. |
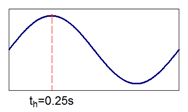
Perpendicular Line |
A perpendicular line from a particular point on the curve to one of the edges of the diagram. |
Tangent |
A tangent at a point on the curve. |
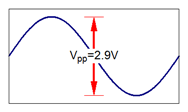
Dimension Line |
A dimensioned distance in the Y direction, X direction or in any direction. |
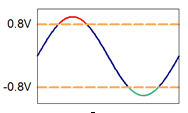
Tolerance Band |
A horizontal or vertical tolerance band. A color change can be enabled for the curve when the tolerance is overshot or undershot. |
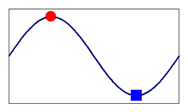
Symbol |
A symbol that highlights a particular point on the curve. |
Dimensioning is added as special markers in the diagram so that they are always correctly scaled with the diagram when subsequently zooming into the curve. Like other markers, you can reposition or design dimensions afterwards.
The current cursor positions are used as the initial points for the coordinates used for new dimensioning. These do not necessarily have to be on a curve. You can work with free cursors.
Accessing Cursors and Markers with FPScript
You can access the current cursor positions and markers with FPScript and thus use these within analyses. For instance, using both cursors you can select a range for which an analysis is to be calculated, or you can select events in a signal using markers that you can then access in FPScript formulas. To do this, the diagram, document and the worksheet provide you with Properties with which you can access the cursors and markers. For example, the following FPScript formula accesses the current cursor positions of the second pane of a worksheet in order to form a signal segment:
Signal[Worksheet.WKS.Cursor(fpCursorMinX, 1).PositionIndex, _
Worksheet.WKS.Cursor(fpCursorMaxX, 1).PositionIndex]
See Also
Activating and Setting Up Cursors
Toggling Cursors in a Document or Diagram
Toggling Auxiliary Cursors On and Off
Changing the Number and Spacing of Auxiliary Cursors
Toggling Coordinates Displayed at Cursor On and Off
Excluding a Curve from Cursoring
Customizing the Display of Cursors
Moving the Cursors
Moving the Cursors Using the Keyboard
Moving the Cursors with the Mouse
Navigating to Peak Values or Markers
Navigating to a Specific Point in a Diagram
Navigating to a Frame in a Video
Changing the Image Section
Stretching and Compressing the Curve
Adapting the Image Section to the Curve
Adjusting the Image Section when Moving Cursors
Working with Markers
Assigning Media as a Source for Image Markers
Customizing the Display of Markers
Working with Data
Working with the Coordinates Window
Displaying and Hiding the Coordinates Window
Changing Coordinates Window Display Options
Changing the Coordinates Window Output Format
Opening a Data Set Displayed in the Coordinates Window
Copying a Value from the Coordinates Window
Copying the Contents of the Coordinates Window to the Clipboard
Inserting Dynamic Coordinates into a Diagram, Document or Worksheet
Changing the Font of the Coordinates Window in a Diagram, Document or Worksheet
Displaying and Hiding a Custom Coordinate
Displaying a Presentation Object in the Coordinates Window
Working with Curves
You might be interested in these articles
You are currently viewing a placeholder content from Facebook. To access the actual content, click the button below. Please note that doing so will share data with third-party providers.
More InformationYou need to load content from reCAPTCHA to submit the form. Please note that doing so will share data with third-party providers.
More InformationYou are currently viewing a placeholder content from Instagram. To access the actual content, click the button below. Please note that doing so will share data with third-party providers.
More InformationYou are currently viewing a placeholder content from X. To access the actual content, click the button below. Please note that doing so will share data with third-party providers.
More Information