Determines the statistical parameters for displaying a box plot.
Syntax
BoxPlot(DataSet, [ Mode = PROCESS_COLUMNS ], [ JitterMode = BOXP_JITTER_NONE ] [ , Jitter = 0.25 ])
The syntax of the BoxPlot function consists of the following parts:
Part |
Description |
||||||||
|---|---|---|---|---|---|---|---|---|---|
DataSet |
The data set to be evaluated. Permitted data structures are Data series, Data matrix, Signal, Signal series and List. All numeric data types are permitted. |
||||||||
Mode |
Specifies how data matrices and signal series are to be processed. If you omit the argument, the data is determined column by column. The argument Mode can have the following values:
If the argument is a list, then the first element in the list is taken. If this is also a list, then the process is repeated. If this argument is omitted, it will be set to the default value PROCESS_COLUMNS . |
||||||||
JitterMode |
Specifies how the outliers and the inner points are displayed. The argument JitterMode can have the following values:
If the argument is a list, then the first element in the list is taken. If this is also a list, then the process is repeated. If this argument is omitted, it will be set to the default value BOXP_JITTER_NONE . |
||||||||
Jitter |
Specifies the width of the point cloud to be displayed. The value 0 means that the values are displayed in a line. The value 1 means that the points of the first measurement series are displayed between 0.5 and 1.5 if they are drawn above the box, or that the points of the first measurement series are displayed between 0 and 1 if they are drawn next to the box. Permitted data structures are Scalar value. All numeric data types are permitted. The value must be greater or equal to 0 and less or equal to 1.0. For complex data types the absolute value is formed. If the argument is a list, then the first element in the list is taken. If this is also a list, then the process is repeated. If this argument is omitted, it will be set to the default value 0.25 . |
Remarks
The box plot, also known as the box-whisker plot or box graph, is a diagram that enables the clear presentation of the most important robust measures of position and dispersion. The minimum, the lower quartile, the median, the upper quartile and the maximum are shown. The function determines these statistical parameters and returns them as a list.
The following graphic shows a box plot:
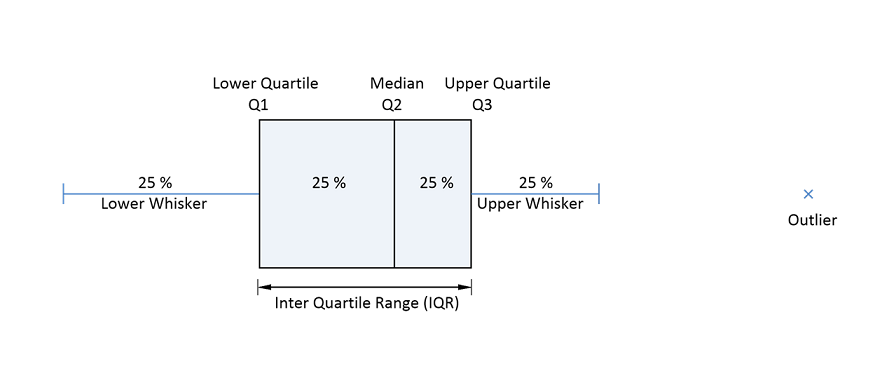
The box corresponds to the area in which the middle 50 percent of the data lies. It is therefore limited by the upper and lower quartiles. The length of the box corresponds to the interquartile range (IQR). This is a measure of the dispersion of the data, which is determined by the difference between the upper and lower quartiles. The median is also displayed as a continuous line in the box. This line divides the entire diagram into two areas, each containing 50 percent of the data.
The values outside the box are displayed as whiskers. The length of the whiskers must be limited to a maximum of 1.5 × IQR. However, the whisker does not end exactly at this length, but at the value from the data that is still within this limit.
Data series or signals provide exactly one box. For matrices or signal series, the number of boxes corresponds to the number of columns or number of rows, depending on the selected mode. With lists, on the other hand, the list elements are considered individually and the result is one or more boxes.
The function returns the following results as a list:
List Element |
Description |
|---|---|
Q1 |
Lower Quartile The smallest 25 % of the data values are smaller than or equal to this characteristic value. |
Q2 |
Median The smallest 50 % of the data values are smaller than or equal to this characteristic value. |
Q3 |
Upper Quartile The smallest 75 % of the data values are smaller than or equal to this characteristic value. |
IQR |
Interquartile Range Value range in which the middle 50 % of the data is located. |
LowerWhisker |
Position of Lower Whisker: Q1 - 1,5 × IQR. The value does not correspond to this calculated value, but to the measurement value that is still within this limit. |
UpperWhisker |
Position of Upper Whisker: Q3 + 1,5 × IQR. The value does not correspond to this calculated value, but to the measurement value that is still within this limit. |
InnerPoints |
Inner Points: These are all measurement values that are within the lower and upper whiskers. |
Outliers |
Outliers: These are all measurement values that are outside the whiskers. |
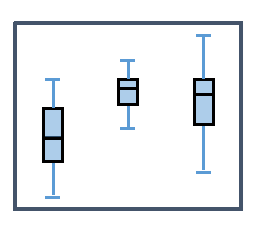
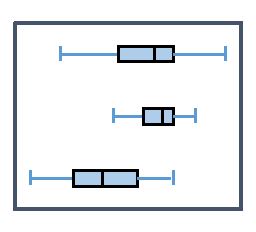
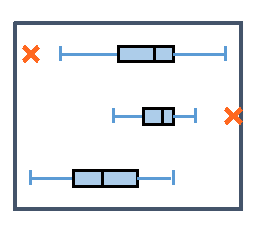
The following display forms of the box plot diagram are possible:
Box plot |
|
|
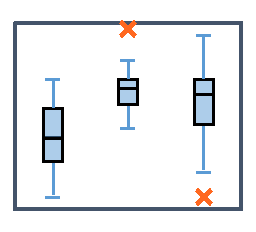
Box plot with outliers |
|
|
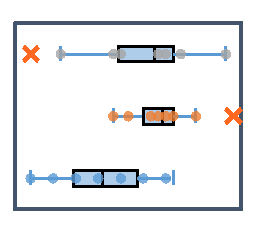
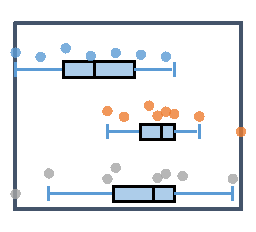
Box plot with outliers and inner points |
|
|
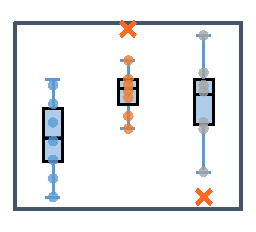
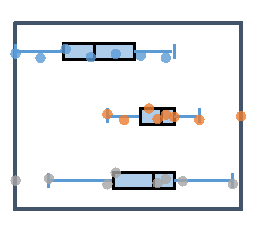
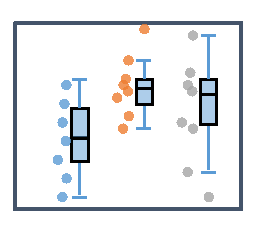
Box plot with jitter display, outliers and inner points above the box |
|
|
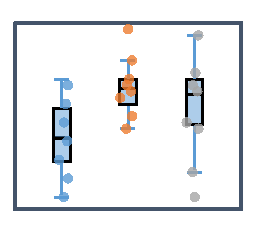
Box plot with jitter display, outliers and inner points beside the box |
|
|
Available in
FlexPro Basic, Professional, Developer Suite
Examples
BoxPlot({2, 5, 7, 1, 3}) |
Provides a list with the statistical parameters for displaying a box plot. |