Determines the constant, linear or adaptive trend of a data set.
Syntax
Trend(Signal, [ Mode = TREND_CONSTANT ] [ , Parameter = 0 ])
The syntax of the Trend function consists of the following parts:
Part |
Description |
||||||||
|---|---|---|---|---|---|---|---|---|---|
Signal |
The data set with the trend you want to calculate. Permitted data structures are Data series, Data matrix, Signal, Signal series and Signal series with two-dimensional X-component. All numeric data types are permitted. If the argument is a list, then the function is executed for each element of the list and the result is also a list. |
||||||||
Mode |
Specifies whether a constant, linear or adaptive trend is to be determined. The argument Mode can have the following values:
If the argument is a list, then the first element in the list is taken. If this is also a list, then the process is repeated. If this argument is omitted, it will be set to the default value TREND_CONSTANT . |
||||||||
Parameter |
Controls the algorithm for the calculation of the adaptive trend. If positive and specified without a unit, it specifies the number N of neighbors to be taken into account when determining the next relevant sampling point. If negative or specified with the unit "%", it specifies the hysteresis as a percentage of the span of the data set with which local maxima are searched to determine N automatically. If you omit the argument or pass 0, this corresponds to an hysteresis of 5 %. Permitted data structures are Scalar value. All numeric data types are permitted. For complex data types the absolute value is formed. If the argument is a list, then the first element in the list is taken. If this is also a list, then the process is repeated. If this argument is omitted, it will be set to the default value 0 . |
Remarks
The result has the same structure and unit as the argument Signal.
For composite data structures, only the Y component is considered and the X or, if applicable, Z component is copied into the result without modification. For data matrices and signal series, the calculation is carried out for each column or each signal therein. The calendar time and time span data types remain in the result. For all other numerical data types, the result is of a 64-bit floating point value.
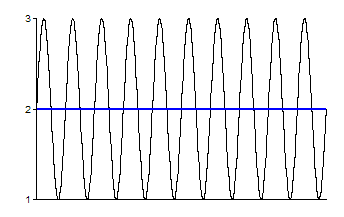
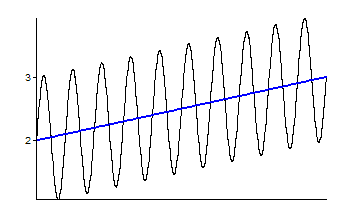
When determining the constant or linear trend, the mean value of the signal is first calculated and then a search begins for the first and last level crossing using this value. If two level crossings are found, the mean value or the best straight line is calculated only for the range between these two level crossings. This prevents errors that occur due to the phase cut-off of periodic signals at the ends of the data set. If no level crossings were found, then all values are included in the calculation.
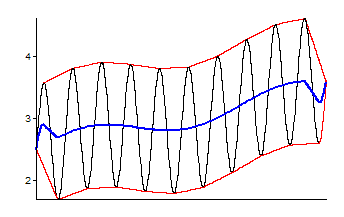
For calculating the adaptive trend, the upper and lower envelope of the signal are calculated with the same algorithm, which is also used by the UpperEnvelope and LowerEnvelope functions. These envelopes are then sampled using linear interpolation for all X values of the data set. The arithmetic mean is then formed from these two envelopes.
Available in
FlexPro Basic, Professional, Developer Suite
Examples
Trend(Signal(Sin(2. * PI * (1000, 0, 0.01)), (1000, 0, 0.01))) |
Calculates a constant data set with the mean of the sinusoidal signal. |