Parametric Spline Interpolation Analysis Object *
You can use this analysis object to perform a parametric spline interpolation for your data, which means that you can calculate a smooth curve that connects the points in your data set. As opposed to spline interpolation, parametric spline interpolation also allows for interpolation of curves whose X values are not strictly increasing, such as locus curves or contour lines.
To calculate the parametric spline interpolation, FlexPro first generates a parameter data set T with strictly increasing values that is derived from the X and Y values of the data set to be interpolated. Two spline interpolations are then performed, one for the function Y(T) and one for the function X(T). As with the standard spline interpolation, you can influence the appearance of the curve by changing the boundary conditions. You can specify this separately for the boundaries of the functions X(T) and Y(T).
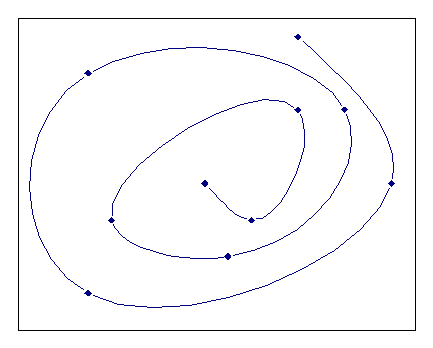
The type determines the appearance of the spline curve at the edges. The parameters X Beginning, X End refer to the spline interpolation of the function X(T) and Y Beginning, Y End refer to the spline interpolation of the function Y(T). The boundary conditions Curvatures at the edges equal to zero results in natural parametric splines, as shown in the following illustration. Not-A-Knot means that the 3rd derivations of Y(T) and X(T) at the edges are to be constant.
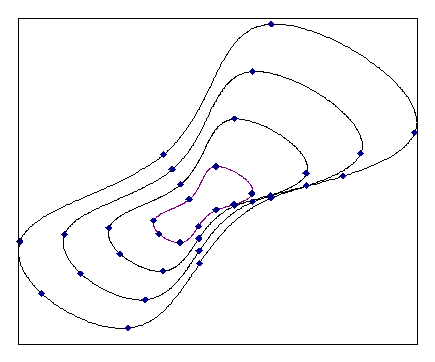
The periodic, parametric spline interpolation generates closed curves that have no kink at the joint. However, the first and last point in the curve must match. If this is not the case, FlexPro uses one of two methods to force the periodicity. If you select Periodic, periodicity by replacement, the last point in the data set is ignored and a copy of the first point is used instead. However, if you select Periodic, periodicity by appending a copy of the first point is appended to the data set if the last point in the data set is not identical to the first point.
An example for periodic, parametric splines is shown in the following illustration:
The result of the spline interpolation is first a mathematical model of the data set to be interpolated. The Sampling mode specifies at which points the calculated spline curve is to be sampled to obtain the result data set. You can specify whether a data set with a total of N points with equal spacing (related to the parameter data set T) is to be calculated or whether each original T-interval is to be divided into N parts.
FPScript Functions Used
See Also
Spline Interpolation Analysis Object
* This analysis object is not available in FlexPro View.