New Features in FlexPro 2025

FlexPro 2025 brings numerous innovations that take your data analysis to the next level. One highlight of FlexPro 2025 is the integration of the Python programming language. Benefit from extensive libraries and expand your analyses with innovative solutions from areas such as machine learning and artificial intelligence.
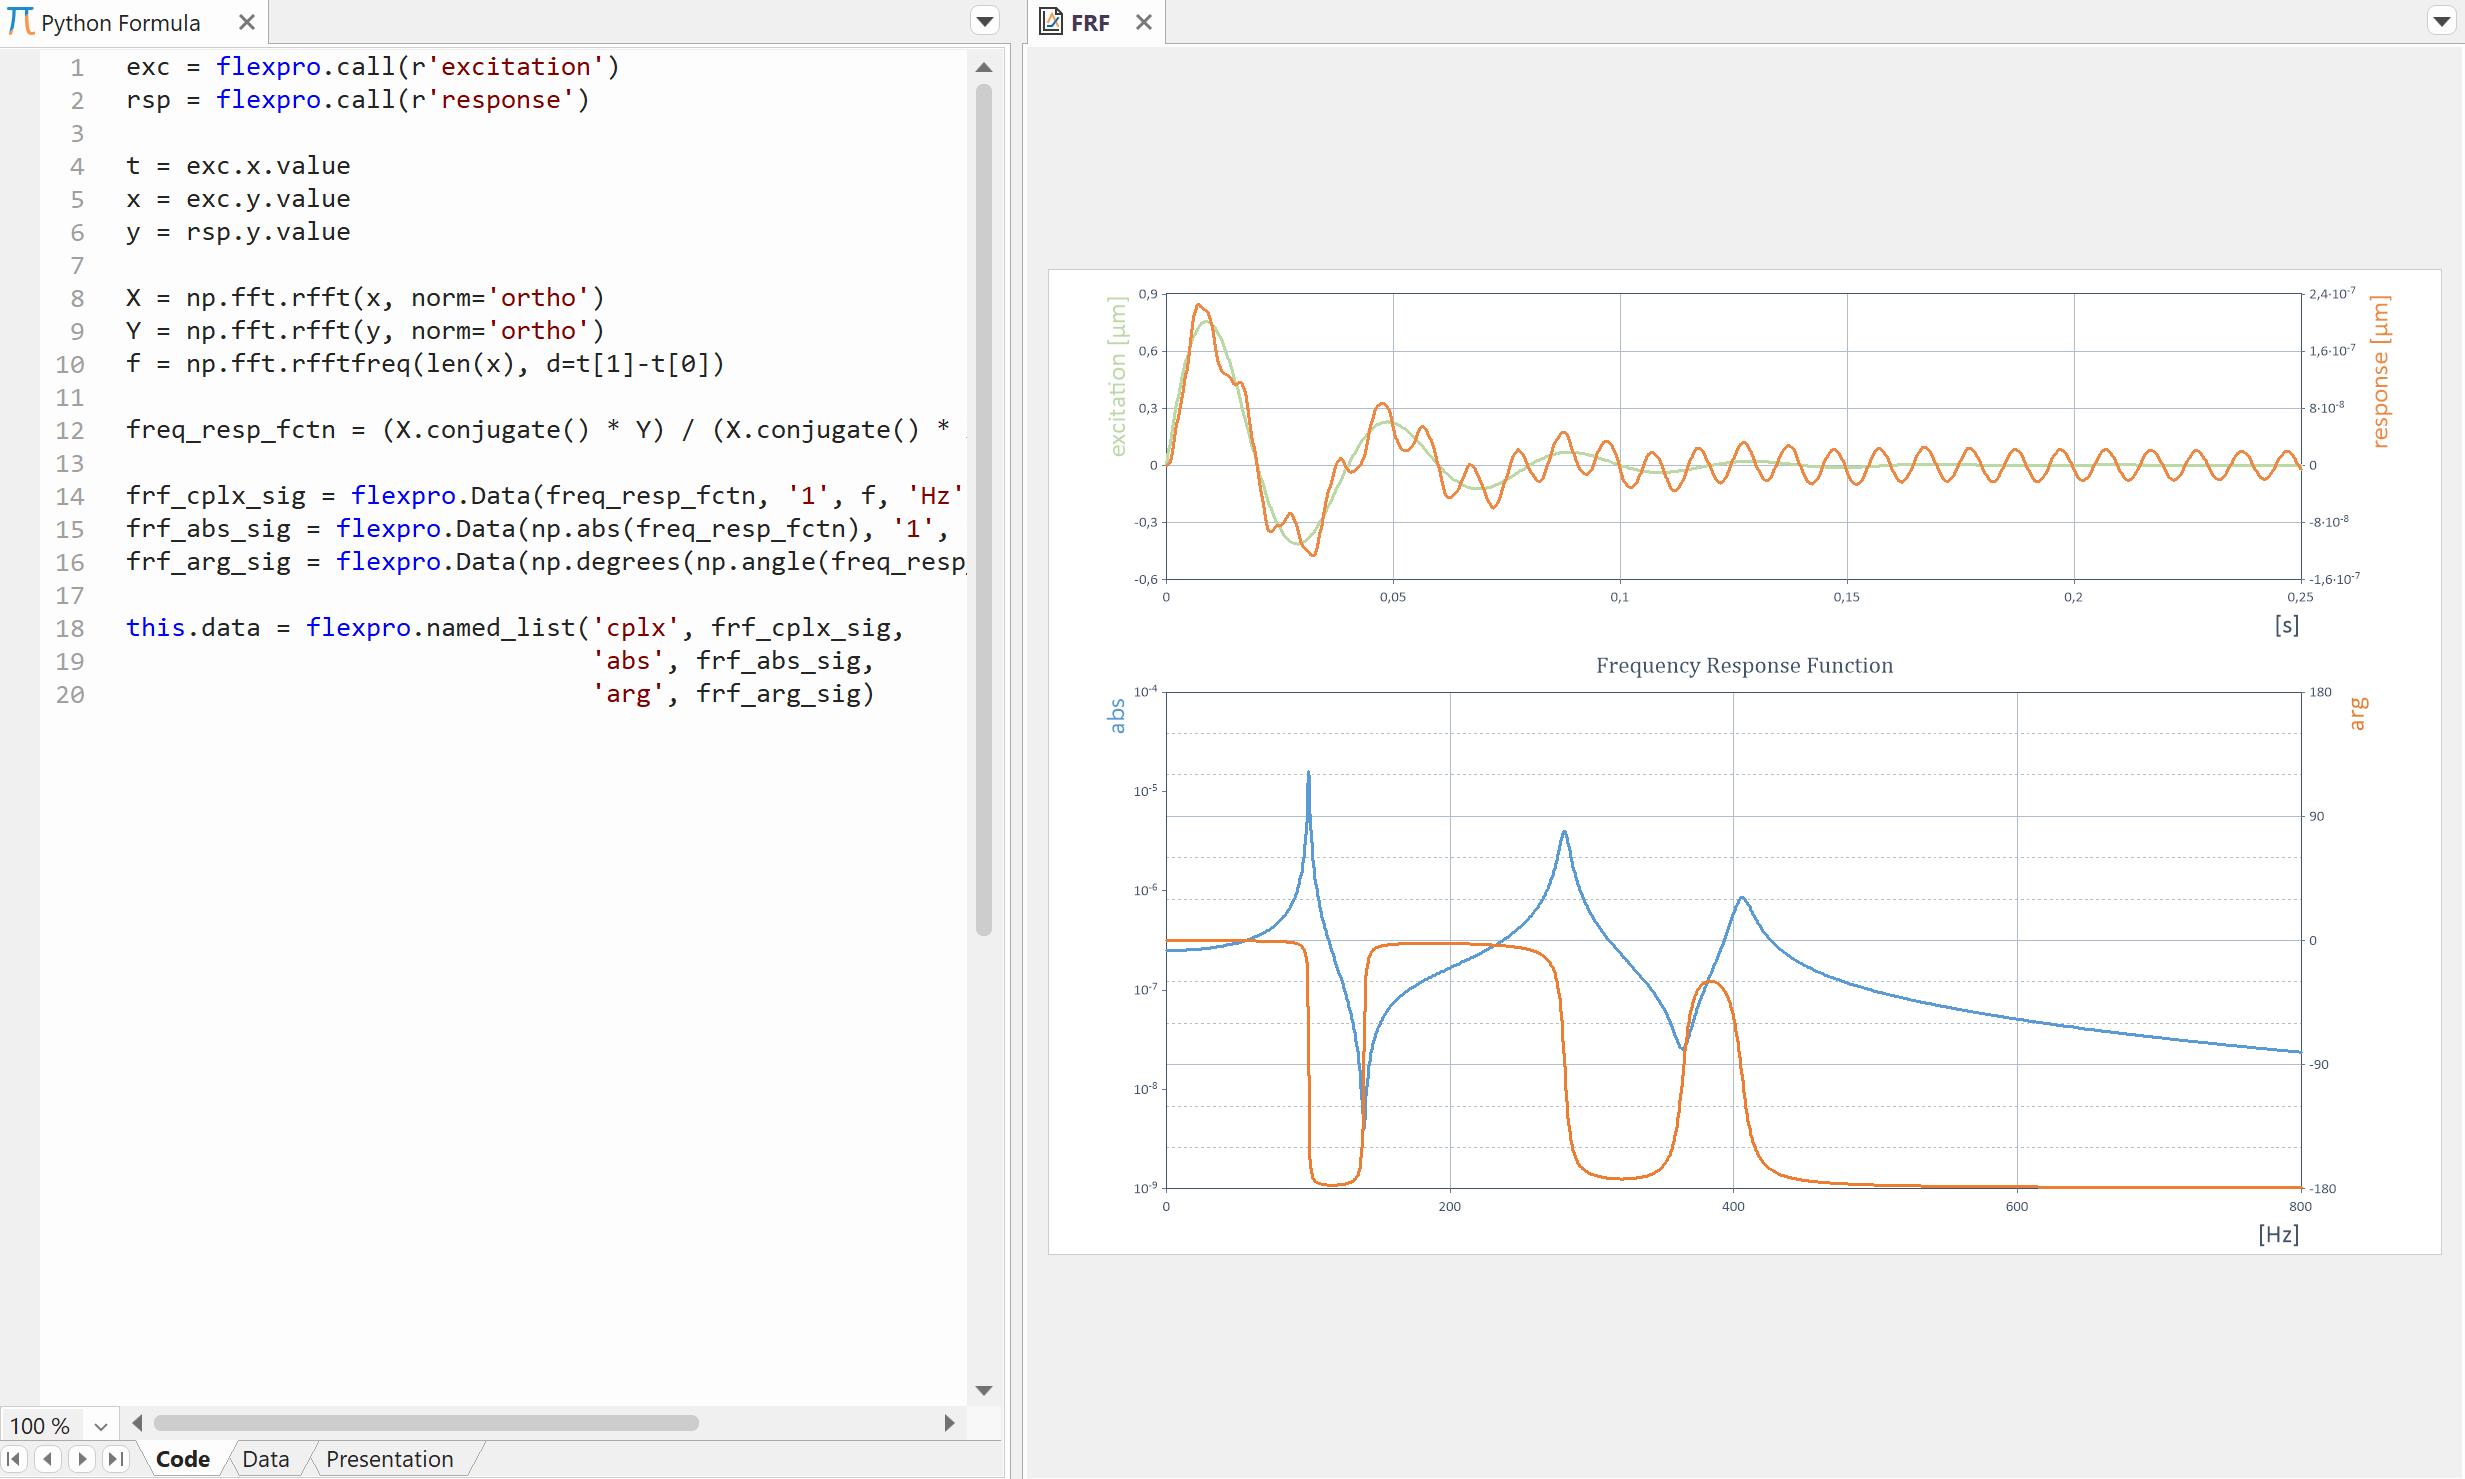
NEW: New Python Integration
The seamless integration of the Python programming language is the highlight of FlexPro 2025. Gain access to one of the most widely used programming languages and benefit from a globally active user community.
Python comes with a variety of powerful libraries you can use for your analyses. Discover exciting new possibilities in areas such as machine learning and artificial intelligence with FlexPro 2025.
- Integrate Python directly into FlexPro: Now you can create Python formulas in addition to FPScript formulas and use them just like other objects in FlexPro.
- Maximum flexibility: Benefit from the freedom to use any Python functions directly in FPScript formulas.
- Unlimited possibilities with your Python modules: Access unlimited modules from your own Python installation to create customized solutions and make your data analysis even more powerful.
- Seamless reuse of your existing Python scripts: Spend less time on customization. Already developed Python scripts can be easily reused, so you can work even more productively.
NEW: Improved Debugger
The debugger for tracking down errors in formulas has been completely revised. It seamlessly supports both FPScript and Python formulas.
With the new Call Stack window, you can see exactly which formulas have been called up in which order and can switch between the code windows with a simple mouse click.
The new Breakpoints window shows you all breakpoints set in formulas in the project database. You can deactivate breakpoints or navigate to the code line of a breakpoint with a mouse click. Hit counters, break conditions and message output are useful properties of breakpoints.
The revised Monitor window shows you the current result and the contents of all local variables of a formula in a list. You can add any expressions as monitors. You can display non-scalar data at the touch of a button in the Data preview window.
NEW: New Project Database Functions Make Your Work Even More Convenient
Easily navigate from folder to folder in the project database with the new object list navigation bar. Save valuable time with the new Find and Replace dialog box and quickly search selected objects, folders or the entire project database for text that you want to replace.
The new Import and Add selection option leaves existing data records in the folder unchanged and adds newly imported data records.
Series analyses with FlexPro are now even more convenient: Multi-channel analyses that return a list of data sets as a result are now displayed like folders in the folder window. If you select such a list there, its list elements are displayed in the object list, where you can select them individually.
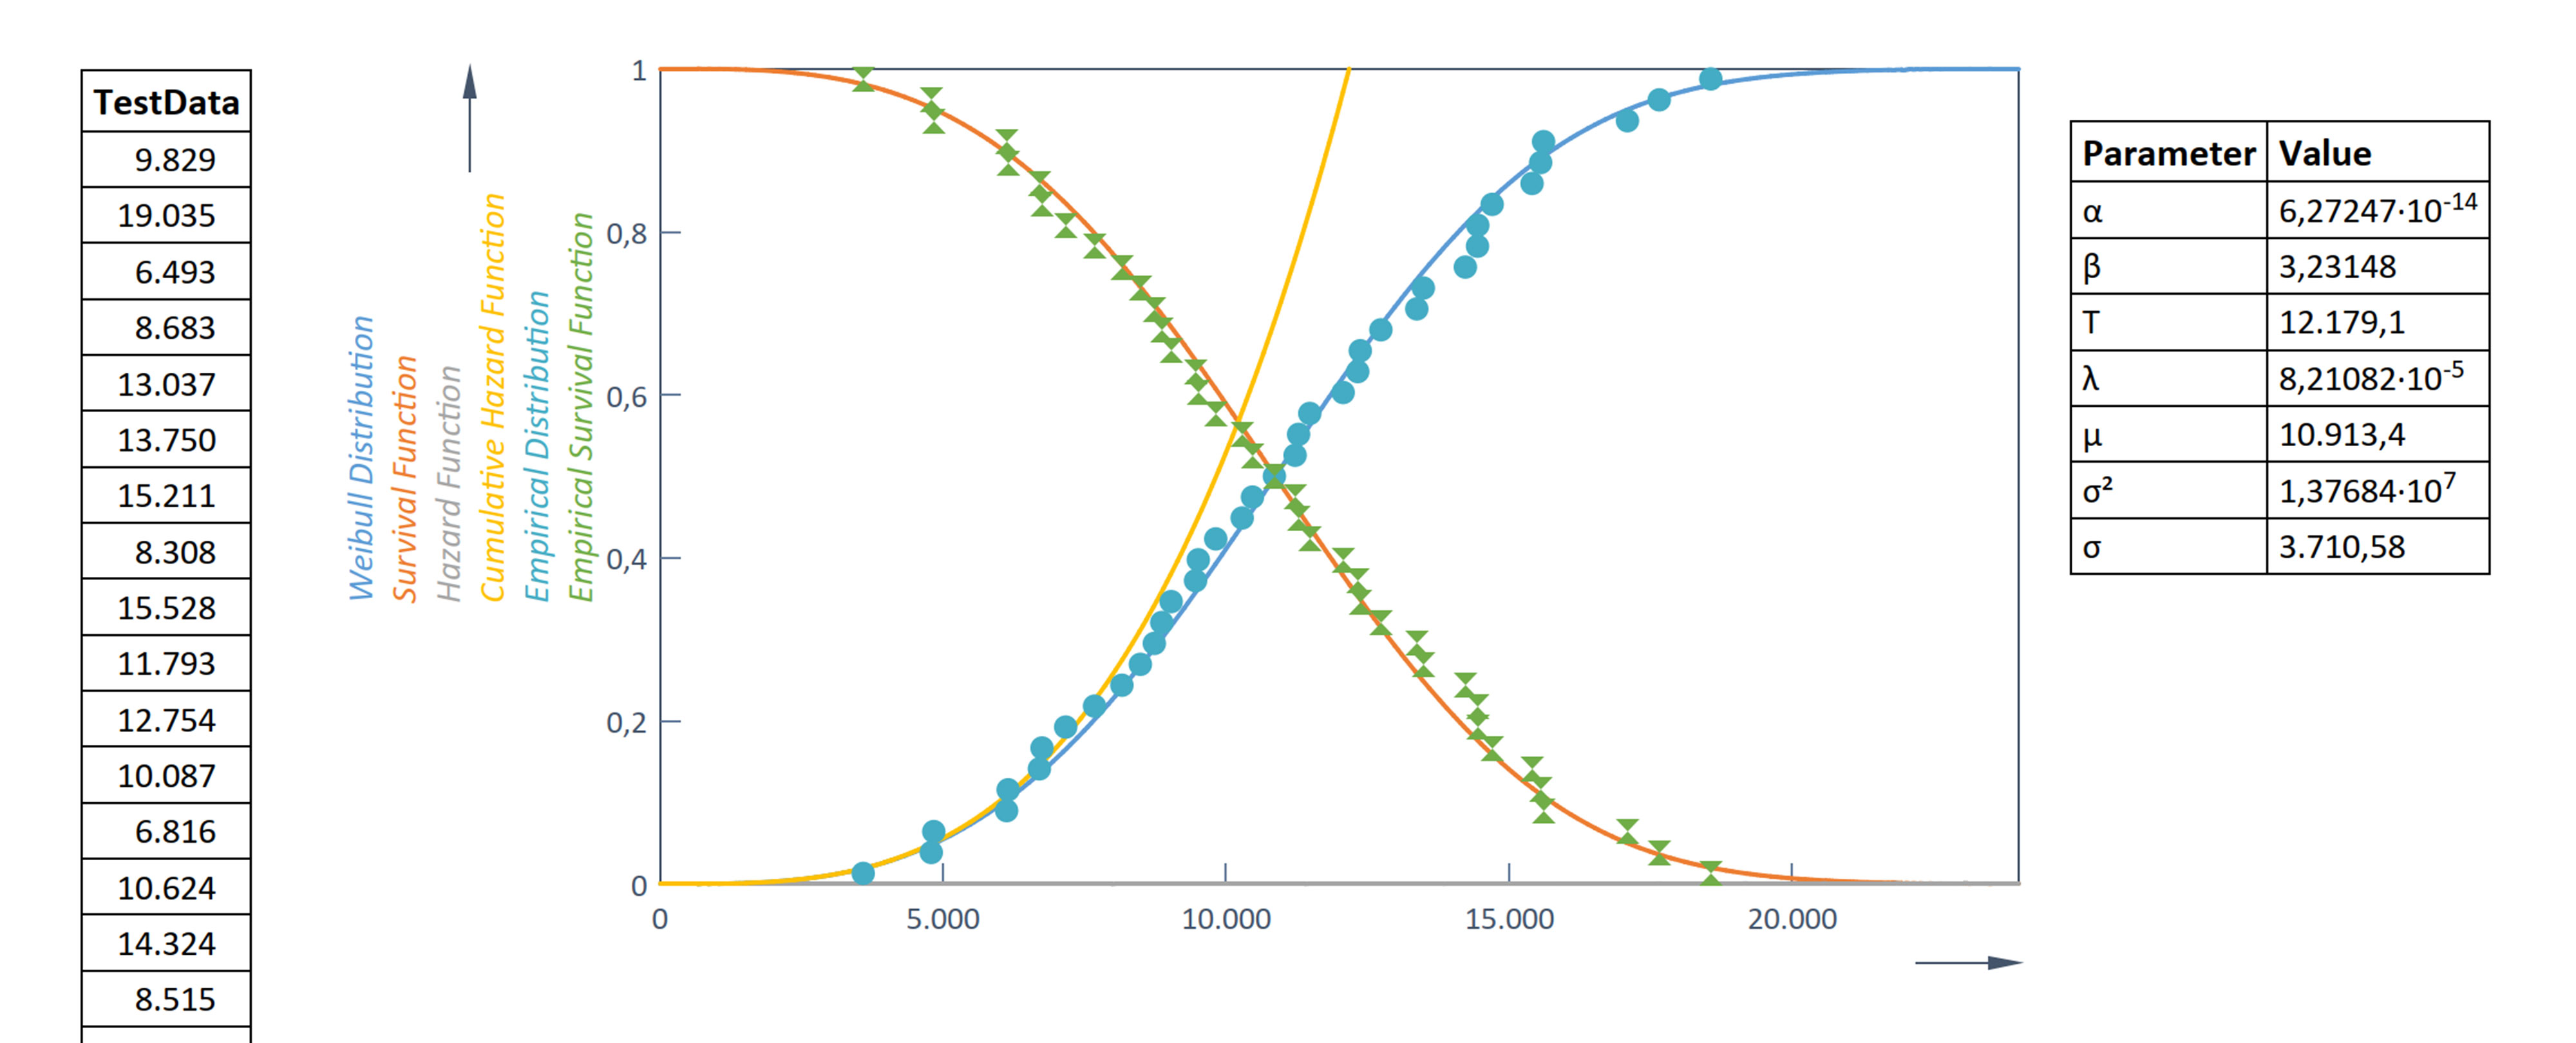
NEW: New Analysis Objects for Precise Service Life Forecasts and Empirical Distribution Functions (Statistics Option)
The new analysis object Lifetime Analysis now allows you to make predictions about the lifetime of your products using the two-parameter Weibull distribution. The new Empirical Distribution analysis object now allows you to calculate the empirical distribution function for unclassified data.
NEW: Extended Functions in Acoustics for Even More Efficiency (Acoustics Option)
This extension makes the evaluation of acoustic measurement data even more efficient for you. You can now easily specify whether the input data is available as voltage signals or pressure signals. In addition, you now have the option of explicitly selecting no calibration if the data is already calibrated.
NEW: Sorting of Column and Row Table
The new Sort by Column and Row Table function ensures that you have an even better overview of your data. You can now easily display data from a column or row table sorted by any column or row.
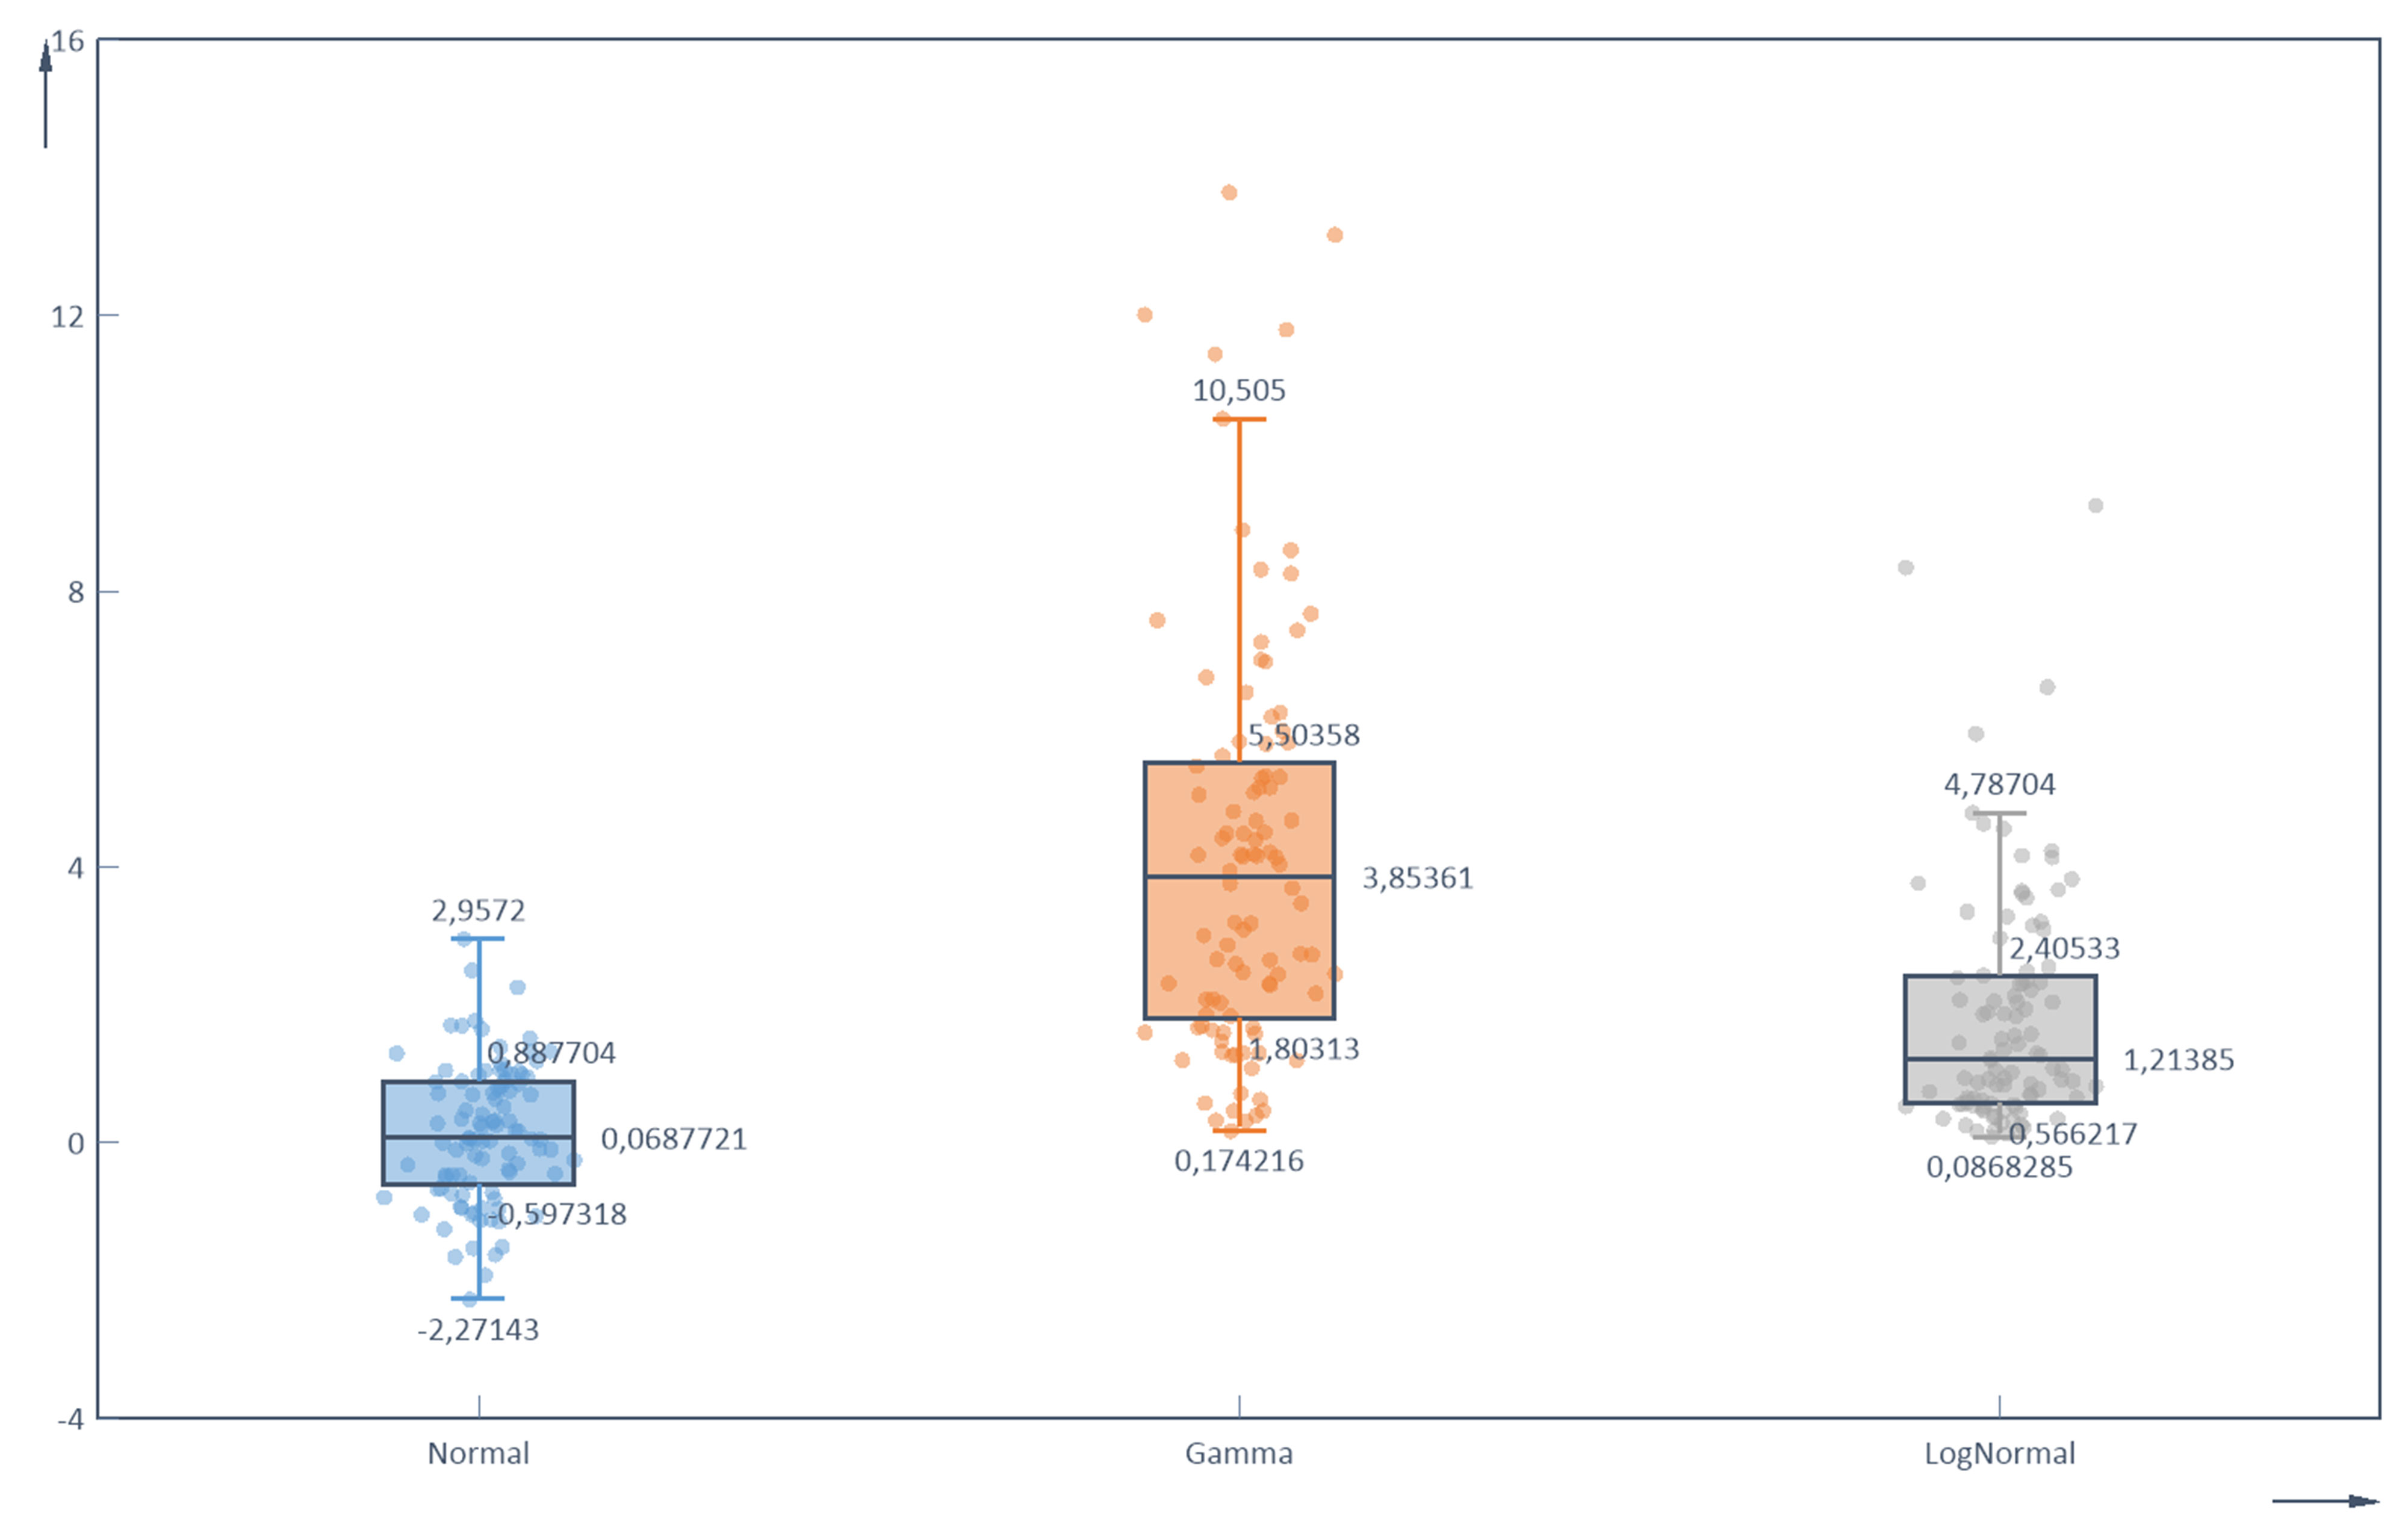
NEW: Diagram Type Box Plot
The new diagram type Box Plot allows you to clearly display the most important robust measures of position and dispersion. The minimum, the lower quartile, the median, the upper quartile and the maximum are displayed.
FlexPro 2025 Offers You Even More:
- Undo global operations
- Undo function for value and field editing
- Undo/redo for setting, removing and designing markers
- File data linking with relative file path or file path given in a data record
- Extension of the Signal Sampling analysis object to include two data reduction methods
- Extension of the Signal Scaling analysis object to include the option of linear scaling of the X-component of a data set
- Numerical parameters of analysis objects can now be specified directly by a data set reference.
- Updated unit management
- New FPScript functions available


