IIR Filter Analysis Object (Digital Filters Option)
You can use this analysis object to filter signals. You can choose between low pass, high pass, bandpass and bandstop with various characteristics.
The object works with Infinite Impulse Response (IIR) filters, which have internal feedback (recursive filters).
Result
The calculated filter coefficients or the poles and zeros can be output as the result. The result is a list with numerator and denominator coefficients or poles and zeros. In this case, no input data set has to be specified. Alternatively, the result can be a signal that is filtered using the previously calculated IIR filter. To do this, a data set to be filtered must be selected from the Data tab. Unlike the Filtered signal result, the data for the Filtered signal with phase correction result are filtered twice: once forward and once backward. This prevents phase shifts.
Filter Characteristics
Filters with the following properties are available:
•Bessel Filter: Filter with good rectangle transmission behavior and flat passband, but with relatively low steepness.
•Butterworth Filter: Filter with flat passband and high edge steepness, but unstable with steep-edged input signals.
•Chebyshev Filter: Even steeper than the Butterworth filter, but with ripple in the passband. This ripple can be reduced at the expense of decreasing the steepness.
•Inverse Chebyshev Filter (Chebyshev II Filter): Displays an equal ripple in the stopband. Even when there is a large distance from the cut-off frequency, the attenuation does not rise above a certain value.
•Elliptic Filter (Cauer Filter): The filter has an even greater filter steepness, with equal ripple in the passband and stopband and non-linear phase response. Preference is given to this filter characteristic for use as an anti-aliasing filter in CW applications (CW: continuous wave). The filter is described by an elliptic differential equation.
Filter Type
The filters can be used as low pass, high pass, bandpass and bandstop.
Order
The filter order determines the steepness of the filter. The higher the order, the higher the filter steepness. High orders of filtering can, however, lead to instability in IIR filters. It is possible to specify a fixed order or to estimate the order. In this case, you have to specify the transitions instead of the cut-off frequencies.
Cut-Off Frequency / Transition
For a fixed filter order, you need to specify a cut-off frequency for low pass or high pass filters. You have to specify two cut-off frequencies for a bandpass or bandstop. If the filter order is estimated, enter the lower and upper limit for one (low pass, high pass) or two (bandpass and bandstop) transitions.
If you click on the option Use normalized frequencies all frequency information will be normalized to the sampling frequency. Otherwise, enter the frequencies in the unit that corresponds to the reciprocal value of the time unit of the signal to be filtered. Due to the Nyquist limit, only values up to a maximum of 0.5 or to half of the sampling frequency are permitted.
Specification
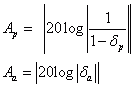
For the Chebychev filter, the ripple Ap can be freely selected, for the inverse Chebychev filter, the attenuation Aa can be specified, and for the Elliptical filter, both the ripple and attenuation are specified. As an alternative to the ripple and attenuation, the passband error δp and the stopband error δa can be specified when Error (Delta) is selected as the mode instead of Ripple/Attenuation.
Amplitude Response, Phase Response, Group Delay (Analysis Wizard only)
Select these options to display additional diagrams. The amplitude response shows how strong individual frequencies are damped. The phase response and the group delay indicate how strong these are delayed. If a frequency of 100 Hz has a phase of -180° for instance, then this means that it is delayed by half a period, i.e. by 5 ms. The delay is the same for all frequencies if the phase response is a declining straight line. The group delay is then a horizontal line.
Example
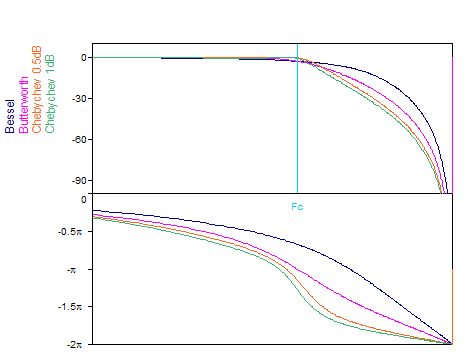
The following illustration shows the Bode's plot with the absolute value and phase spectra of some filters of the fourth order:
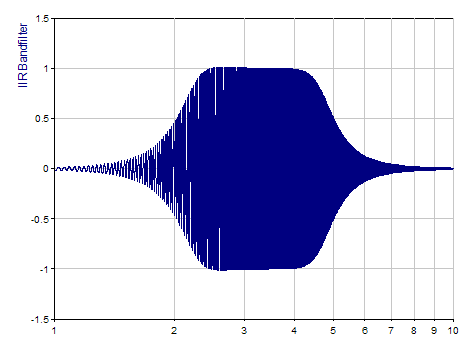
The following illustration shows a swept-frequency signal, which was filtered using a Butterworth bandpass of the fourth order. In the logarithmic X representation, both slopes appear equally steep: