What's New in FlexPro 2017

FlexPro 2017 is the most extensive update in the 25-year history of this analysis software from Weisang.

The new FlexPro 2017 with a fully redesigned Microsoft Office-like interface excels not only in its ease of use, but also in its expert ability to analyze series measurements and data archives.

NEW

FlexPro with Redesigned User Interface

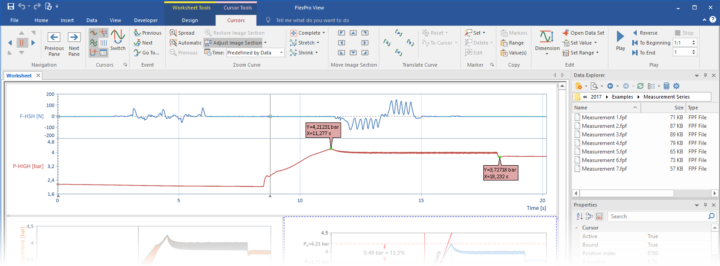
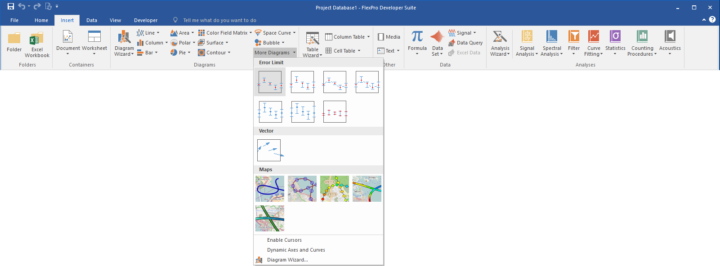
The new Microsoft Office-like ribbon makes FlexPro 2017 very easy to use. It highlights important commands and dynamically inserts optional tools. That improves the software’s layout and ease of use.

Choose objects and style elements from neatly arranged galleries.
The cursor tools are displayed as soon as you activate the cursors.

NEW

Diagram and Table Format Templates

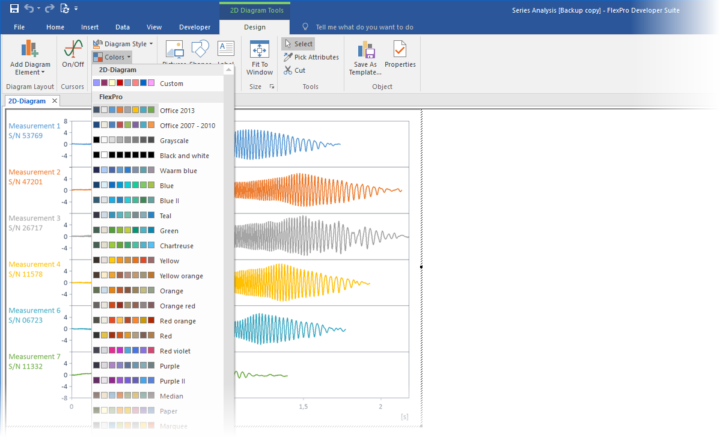
You can now adjust the design of your diagrams by changing the diagram style and color scheme.

The color scheme determines the color of the curves.
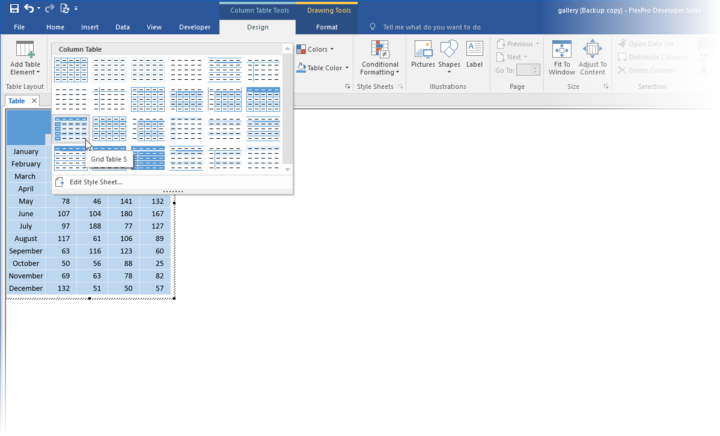
Just choose a table style sheet from the gallery.

NEW

Conditional Formatting of Tables

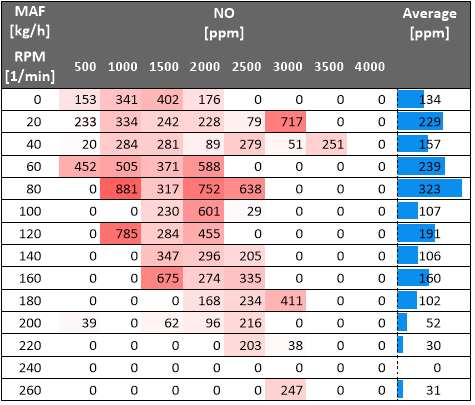
Use conditional formatting to improve the readability of data tables. Use rules to highlight extreme values or duplicates. Visualize the relative quantity of data using data bars or color scales. One look at a table with this formatting is enough to give you a general overview of your data.
Use data bars or manage the text and background color depending on the data.

NEW

File Indexing in Client/Server Mode

The FlexPro Data Explorer option indexes measurement data archives on the server or your hard disk. FlexPro 2017 calculates characteristic quantities during indexing. You can then use these quantities for subsequent queries.
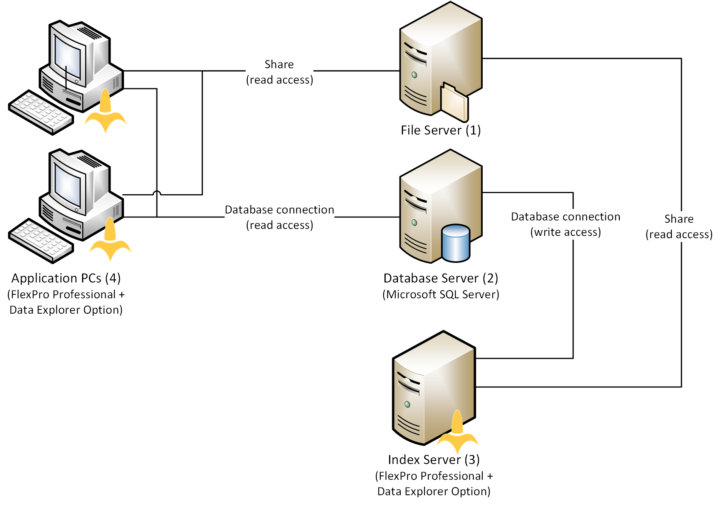
Use the new FlexPro 2017 index server to grant your entire team access to your company's measurement data archive (Microsoft SQL Server license required).
Long-term measurements are often stored as a sequence of files, each of which contains a small time interval of the measured data. When querying such data, FlexPro 2017 automatically concatenates them and provides the complete time range as a single data set.

With file indexing in client/server mode, an instance of FlexPro carries out the indexing and stores the results in a Microsoft SQL Server database.

NEW

Dynamic Presentations

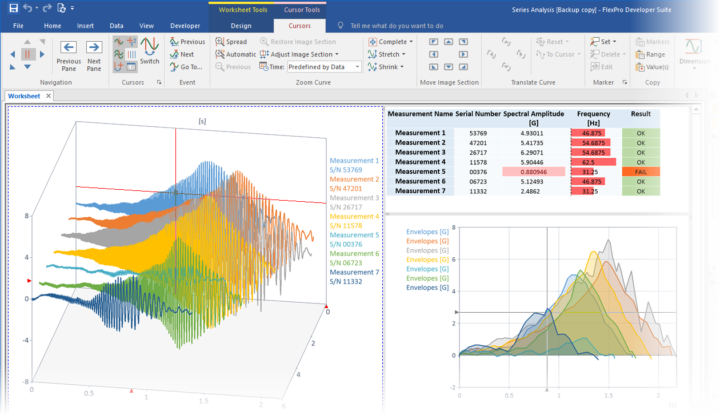
When analyzing test series, the number of data sets to evaluate and results to present vary. FlexPro 2017 makes it easy for you to present this type of measured data.
The dynamic diagrams and tables automatically adjust to the number of data sets to display.

The number of curves and table cells varies with the number of analyzed units under test.

NEW

Intelligent Text Data Import

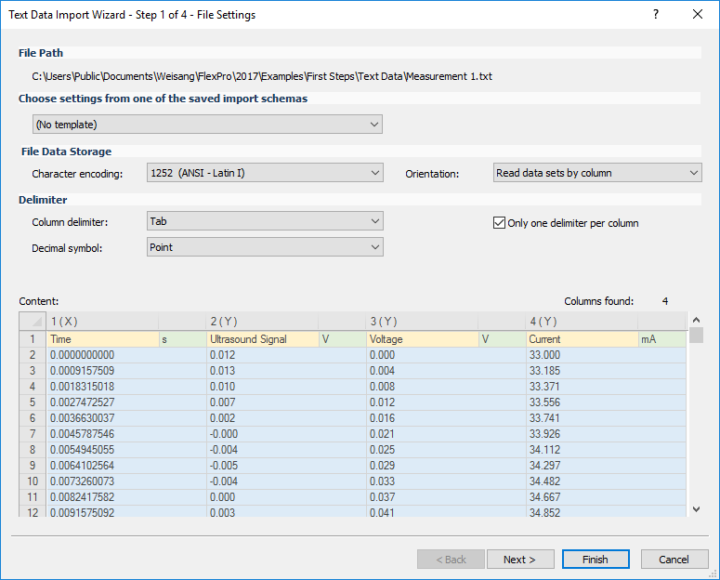
The completely redesigned Import Wizard for text data now recognizes most file formats automatically and features optional settings that you can use to import even very complicated data formats. The following is a list of key new features:

  • Improved automatic data format recognition.
  • Easy to use interface with found elements highlighted in color.
  • Support for different character encodings.
  • Import data arranged in rows.
  • Support for time zones and languages when decoding date values.
  • Filtering of headers from the data stream.
  • Recalculation of imported data.
  • XML-based Import Schemas.
  • Share import schemas with colleagues.
FlexPro automatically detects names, units and data in the text file.

New in FlexPro 2017 – Overview of the Most Important Features:

  • New intuitive interface with the look and feel of MS Office.
  • Diagram and table format templates.
  • Conditional formatting of tables.
  • Dynamic diagrams and tables.
  • Intelligent text import.
  • File indexing in client/server mode (optional).

FlexPro 2017 Offers Even More:

  • A new analysis object to calculate instantaneous amplitude, frequency and phase.
  • Multichannel analysis templates.
  • Advanced cursor functionality.
  • Improved and additional FPScript functions.
  • Multichannel index operation in FPScript.
Try FlexPro 30 days for free!
Try FlexPro out on a real-world project: discover all the features of FlexPro for free over 30 days.

Try FlexPro For Free