FIR Filter (Equiripple Method) Analysis Object and Template (Digital Filters Option)
You can use this analysis object to filter signals. You can choose between low pass, high pass, bandpass, bandstop and multiband filters with various characteristics.
The object works with Finite Impulse Response (FIR) filters that are calculated using the FIR Equiripple Method.
Result
The calculated filter coefficients can be output as the result. The result corresponds to the filter's impulse response. In this case, no input data set has to be specified. Alternatively, the result can be a signal that is filtered using the previously calculated FIR filter. To do this, a data set to be filtered must be selected from the Data tab. Unlike the Filtered signal result, for Filtered signal with phase correction phase correction takes place using the formula (τ = T/2 (L - 1), if the filter is uneven or τ = LT/2 if the filter is even (L = filter length).
Filter Template
Predefined templates are available for low pass, high pass, bandpass, bandstop and multiband. With the exception of the multiband filter, no other bands can be added to or deleted from the Bands list. The gain factors are also predefined. However, the transition cut-off frequencies and the errors/weightings can be changed. You also have the option of creating your own filter templates. To do this, edit the bands, enter a filter name under Filter Template, and press Save. Naturally, you can also delete your own templates. FlexPro saves the templates in your user profile.
filter length
The filter length determines the steepness of the filter. The longer the filter, the higher the filter steepness. You can also specify a fixed length or estimate the filter's length. In this case, the optimal filter is calculated based on the available specification. If a fixed filter length is specified, only one weighting can be provided for the individual bands, since it has not been established that a desired filter tolerance can be achieved. If the filter length can be calculated, the absolute errors are specified for the bands.
Gain Factor
Two gain factors can be defined for each band. The first value is the gain factor for the lower cut-off frequency, and the second value is the gain factor for the upper cut-off frequency. 0 defines a stopband and 1 defines a passband. Another alternative is to specify the gain factors as a data set. The data set can be specified either as a data matrix or as a signal. For each band, the data matrix must contain a column with two values that assign the gain factors to the cut-off frequencies. The signal assigns gain factors to the normalized frequencies from 0 to 0.5. You can use this to define a continuous curve for the amplitude response. However, only the frequency ranges are used that are defined in the list with the frequency bands. It is also possible, however, to define a single band across the entire frequency range from 0 to 0.5.
Weighting / Approximation Error
For each band, either an approximation error (filter length is calculated) or a weighting (fixed filter length) is specified. For the weightings, only the proportions and not the absolute values are relevant. The error arising from the fixed filter length in this case is distributed only to the bands. For a multiband filter with three bands, the weighting information {1, 10, 1} means, for instance, that the second band has a ripple that is ten times lower than the other two bands. This range is thus smoother. You can also specify the weightings as a data set. The data set can be specified either as a data series or as a signal. The data series must contain exactly one value for each band. The signal assigns weightings as a continuous curve to the normalized frequencies from 0 to 0.5.
Bands
Here you enter the bands that specify the filter. When adding a band before an existing band for a multiband filter, select the existing band and then click on Add Band. When appending a band to the end of the list, deselect the band by clicking in the area below the list before clicking on the Add Band button. In order to edit an item in the list, you have to double-click on the item. You can also delete a band. At least one band must be defined.
If you click on the option Use normalized frequencies all frequency information will be normalized to the sampling frequency. Otherwise, enter the frequencies in the unit that corresponds to the reciprocal value of the time unit of the signal to be filtered. Due to the Nyquist bound, only values up to a maximum of 0.5 or to half of the sampling frequency are permitted.
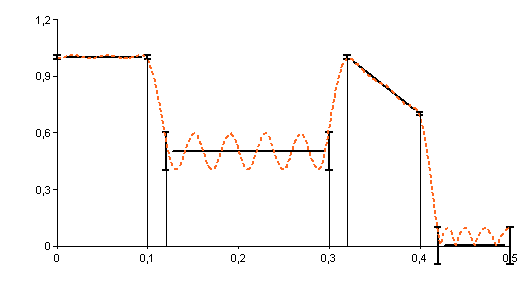
Example
The data:
Band |
Fc1 |
Fc2 |
Fc1 Attenuation |
Fc2 Attenuation |
Error |
|---|---|---|---|---|---|
1 |
0 |
0.1 |
1 |
1 |
0.01 |
2 |
0.12 |
0.3 |
0.5 |
0.5 |
0.1 |
3 |
0.32 |
0.4 |
1 |
0.5 |
0.01 |
4 |
0.42 |
0.5 |
0 |
0 |
0.1 |
lead to the following specification:
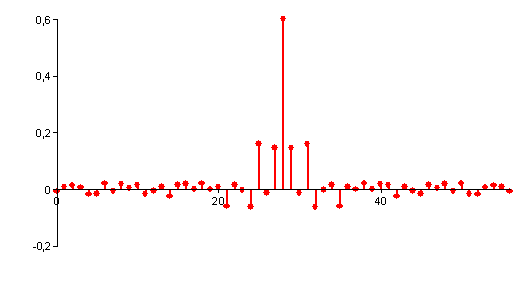
If the filter length is calculated, then the resulting impulse response is: