Envelope Analysis Object *
You can use this analysis object to calculate the envelope of a data set (upper and lower envelope).
The analysis object can process data series, data matrices, signals, signal series and lists.
Three algorithms are available to calculate the envelope: Maximum slope, Peak envelope and Hilbert transform:
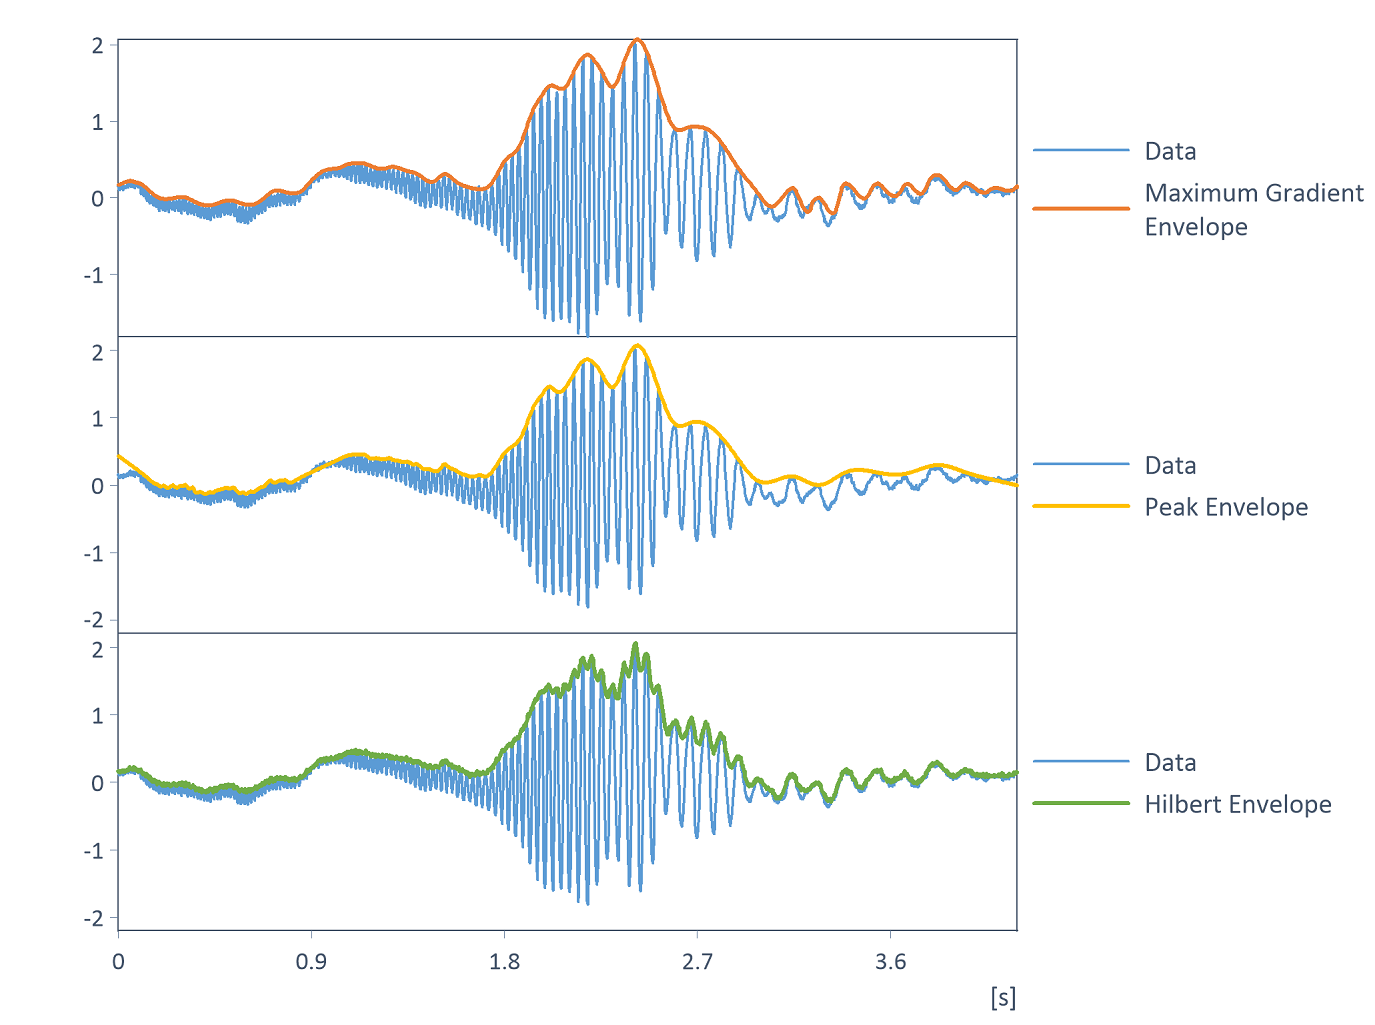
The Maximum slope algorithm is based on the UpperEnvelope or LowerEnvelope function. Starting with the first data point, straight-line connections are calculated for all neighbors of an interval and their slopes are determined. The neighbor with the highest slope becomes the next envelope sampling point and the algorithm is continued with this value. The interval width can be calculated automatically or input manually. The envelope thus has fewer data points than the input data set. Using linear interpolation the sampling of the result can be increased to the sampling of the input data set. Alternatively, the envelope points can be smoothed using spline interpolation.
The peak envelope calculates the envelope points as local extrema (maxima or minima) with the help of the Extrema function. The hysteresis can be specified to determine the extrema. The hysteresis is the minimum amount by which the signal has to rise or fall before and after an extreme so that the point is accepted as an extreme value. You can specify the hysteresis as an absolute value or as a percentage of the span of the data set. Another parameter that can be set is to determine whether the boundary points of the envelope match the boundary points of the input data set or are to be extrapolated. Like the Maximum slope algorithm, the sampling of the result can be increased to the sampling of the input data set using linear interpolation or the envelope can be smoothed using spline interpolation.
The Hilbert transform algorithm calculates the envelope with the help of the Hilbert transform. This provides a mathematically exact definition of the envelopes as the absolute value of the analytical signal calculated by the Hilbert transform (also see Calculation of the Analytic Signal). The Hilbert transform internally performs a Fourier Transform (FFT) of the data set. Using zero padding, i.e. by selecting the FFT length as greater than the data length, the resolution of the FFT required for the algorithm is increased. The calculation result can thus be improved. In the analysis object, the FFT length can therefore be increased to the next power of two if necessary. For signals that have a trend or offset, the trend must also be removed in advance in order to determine the envelopes using the Hilbert transform. The options provided below match the options available for Signal Analysis - Analysis Object trend removal:
Selection |
Meaning |
|---|---|
Constant |
Subtracts the mean value of the data set. |
Linear |
Subtracts the best straight line, i.e., the straight line for which the sum of the squares of the deviations to the data set is minimal. |
Adaptive |
Subtracts the mean value of the upper and lower envelope. The setting can be used if the present trend is neither a constant nor linear, but time dependent. |
Moving average |
Subtracts the moving average. The interval width required to form the moving average can be entered. The setting can be used if the present trend is neither a constant nor linear, but time dependent. The moving average filter is a high-pass filter. |
DC offset filter |
High-pass filter for removing the DC offset (IIR Butterworth high-pass). The cut-off frequency and the order (i.e. steepness) of the high-pass filter can be configured. The filter can be used if the present trend is neither a constant nor linear, but time dependent. |
Suitable setting options for removing a time-dependent trend are usually subtraction of the moving average and the DC offset filter.
FPScript Functions Used
See Also
Instantaneous Quantity Analysis Object
Event Isolation Analysis Object
Spline Interpolation Analysis Object
Calculation of the Analytic Signal
* This analysis object is not available in FlexPro View.