Polar Graph
All 2D diagram display formats are also available for the polar graph. Here, the complete diagram is transformed into a full circle, a segment of a circle or a ring by using polar transformation. The X axis of the 2D diagram is transformed into an angle axis, and the Y axis is transformed into a radial axis.
The following illustration shows the transformation from Cartesian graph to polar graph:
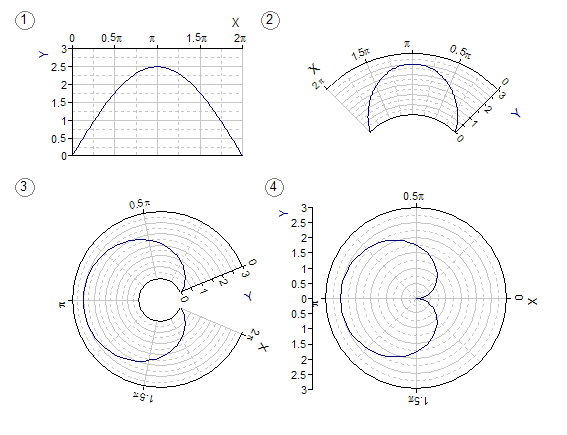
Note that the orientation of the X axis is reversed by the transformation.
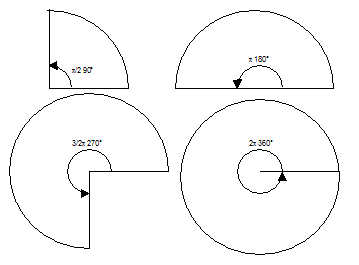
On the Polar Transformation tab of the 2D diagram's Properties dialog box, you can activate polar transformation and set parameters for it. The transformation is controlled by the opening angle, angle of rotation and inner radius attributes. The opening angle determines the size of the circle segment upon which the diagram is formed. An opening angle of 2π or 360° in this case is the equivalent of a complete circle.
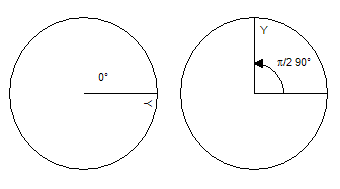
The angle of rotation determines the location of the diagram's original left border. The polar diagram can be rotated counterclockwise.
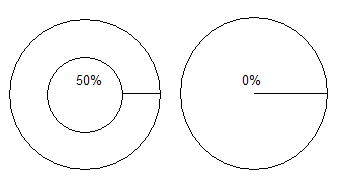
The inner radius is specified in percent and determines whether the diagram is to be in the shape of a circle or a ring.
The X values of the data to be plotted can include the angle in radians (0 - 2π) or in degrees (0 - 360°). The diagram's angle axis is automatically labeled with the respective angles if this is set for metric axis division. It is also possible to label the angle axis in degrees, even though the measured values are in radians, and vice versa. Here, only the respective angle formatter for the axis must be specified.
A polar graph with an opening angle of 2π or 360° and metrically scaled X axis with a start value of 0 is considered closed, i.e. no longer has a start or end value for the angle axis. You can thus also plot data that stretches across a larger angular range than [0, 2π] or [0, 360°], i.e. over several "rotations". Also, with regard to positioning the Y axis or radial axis, the closed polar diagram deviates from the open polar diagram. While the Y axis, depending on the selected position, is plotted for an open diagram at one or both sides or within the circle segment, this is only displayed for the closed diagram within the circle if it was positioned at the axis origin of the X axis. Otherwise, the axis is positioned next to the full circle.
The diagram is usually an exact circle and fits into the center of the diagram's rectangular area. However, if you enable the option Allow elliptical distortion, then the diagram is distorted elliptically so that the diagram's plane is sized for best fit.