Curve Transformation Analysis Object *
With this analysis object, you can convertSpace Curves intoSignal Series and vice versa. A space curve contains scattering data, i.e. Y values that are assigned to any X and Z coordinates. By comparison, a signal series contains a matrix of Y data, which are arranged on a grid. The Y and Z components determine the grid coordinates.
The option Transform signal series with Z components (surface) into a space curve collects the Y values consecutively, i.e. column by column, from the Y data matrix and saves these together with their X and Z coordinates as space curve points.
When the option Convert space curve into surface is selected, the X and Z components of the space curve are first sorted so that they are strictly monotonously increasing. These sorted data sets then form the X and Z component of the signal series. Here, close neighboring values are combined by taking the arithmetic mean. In the second step, the Y values are entered at corresponding (X, Z) positions in the Y data matrix of the result. If several Y values fall on the same position, then these are averaged continuously. Unoccupied positions in the data matrix are marked as void. The value Tolerance determines how closely neighboring points have to lie to one another so that they can be combined into one point. Specify this value in percentage of the range of values for the X or Z component of the space curve. This process is ideal especially for scatter data that are already arranged on a grid.
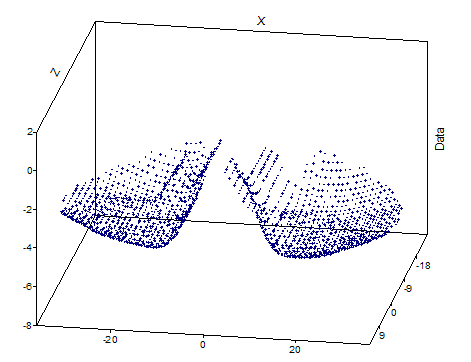
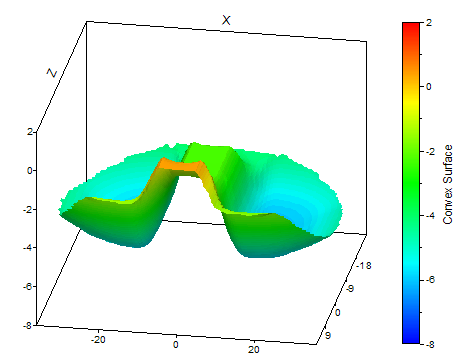
Select Convert space curve into interpolated surface when the scatter data are freely arranged in the space curve. This option first forms a continuous surface for the data based on the "natural neighbor" method. This surface is then evaluated at equidistant grid points to determine the Y values of the result signal series. You can freely determine the number of rows and columns as number of Y values or number of Z values. You can use the option Convex surface to determine what should happen for the grid positions that lie outside of the convex envelope of the space curve X and Z values. If you select this option, these Y values will be set as void. Otherwise, the surface is extrapolated.
The following illustrations show a convex "Natural Neighbor" surface and the data based on it:
FPScript Functions Used
See Also
Surface Interpolation Analysis Object
* This analysis object is not available in FlexPro View.