Correlation Analysis Object *
With this analysis object, you can either calculate the autocorrelation function of a data set or the cross-correlation of two data sets. The Cross-correlation describes the similarity between two signals. The Autocorrelation describes the similarity of a signal to itself.
For the circular correlation the calculation occurs with the assumption that one or more complete periods of a periodic signal are saved in the one data set or the two data sets. For the cross-correlation, both data sets must have the same number of values. The result therefore also has this number of values. If the result has an X component, then this component contains the time lag τ of the correlation function. In the case of autocorrelation, the value τ = 0 is always located exactly at the beginning of the X data series. Therefore, no negative τ is calculated here. Due to the periodicity of autocorrelation, the values in the second half of the result can, however, also be regarded as negative τ.
The non-circular correlation is based on the assumption that the signal or two signals outside of the section specified by the data sets amount to zero. A sufficient number of zeros are therefore appended to the one data set or the two data sets before transitioning to the frequency domain. If the result has an X component, then this component contains the time lag τ of the correlation function. In the case of autocorrelation, the value τ = 0 is always exactly in the center of the X data series.
The normalized correlation values are between -1 and +1.
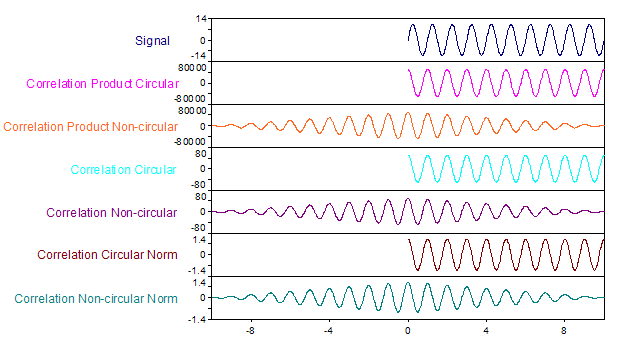
The following illustration shows different variations of an auto-correlation for a sinusoidal signal with a frequency of 1, amplitude of 10 and X range from 0 to 10:
FPScript Functions Used
See Also
* This analysis object is not available in FlexPro View.