Correlation (FPScript)
Determines the correlation matrix of a data matrix or the correlation of two data sets.
Syntax
Correlation(DataSet)
or
Correlation(DataSet1, DataSet2 [ , Mode = PROCESS_COLUMNS ])
The syntax of the Correlation function consists of the following parts:
Part |
Description |
||||||
|---|---|---|---|---|---|---|---|
DataSet |
A data matrix or signal series for which a correlation matrix is to be calculated. Permitted data structures are data matrix, signal series und signal series with two-dimensional X-component. All numeric data types are permitted. For complex data types the absolute value is formed. If the argument is a list, then the function is executed for each element of the list and the result is also a list. |
||||||
DataSet1 |
The first data set to be evaluated. Permitted data structures are data series, data matrix, signal, signal series und signal series with two-dimensional X-component. All numeric data types are permitted. For complex data types the absolute value is formed. If the argument is a list, then the function is executed for each element of the list and the result is also a list. |
||||||
DataSet2 |
The second data set to be evaluated. Permitted data structures are data series, data matrix, signal, signal series und signal series with two-dimensional X-component. All numeric data types are permitted. For complex data types the absolute value is formed. If the argument is a list, then the function is executed for each element of the list and the result is also a list. |
||||||
Mode |
Specifies how two data matrices or signal series are to be processed. The argument Mode can have the following values:
If the argument is a list, then the first element in the list is taken. If this is also a list, then the process is repeated. If this argument is omitted, it will be set to the default value PROCESS_COLUMNS. |
Remarks
The result always has the data type 64-bit floating point.
The correlation of two samples is defined as:
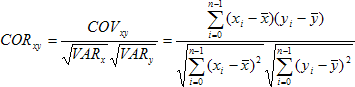
with the mean values
![]()
and
![]()
The range of values of the function is the interval [-1, 1].
If the function is used with one argument, then the argument must be a data matrix or a signal series. The function then calculates the correlation matrix for the columns in DataSet.
If you specify DataSet1 and DataSet2 , then any combinations of the following data structures are allowed: data series, data matrix, signal and/or signal series. For aggregate data structures, only the Y component is taken into account and the X or Z component is adopted in the result when possible. This is preferably taken from DataSet1.
If the Y component of both data sets is one-dimensional, then the result is a scalar value with the correlation of both data sets. If the Y component of one data set is one-dimensional and the Y component of the other data set is two-dimensional, then for each column of the two-dimensional data set, the correlation is calculated with the other data set. The result is a data series or a signal with one correlation per column.
If the Y components of both data sets are two-dimensional, then, depending on the Mode setting, for each column or row in DataSet1 , the correlation is calculated with the respective column or row in DataSet2. The result is a data series or a signal with one correlation per column or row.
If the data sets exhibit different numbers of rows or columns, then the excess rows or columns are ignored.
Available in
Option Enhanced Statistics
Examples
Correlation({5, 3, 4}, {3, 2, 1}) |
Results in 0.5. |
Correlation({{1, 3, 5, 2, 4}, {2, 6, 10, 4, 8}}) |
Results in {{2.5, 1}, {1, 10}}. |
Correlation({{1, 3, 5}, {3, 2, 4}}, {{2, 3, 7}, {3, 4, 6}}, PROCESS_ROWS) |
Results in {1, -1, 1}. |
See Also
References
[1] "Hartung, Joachim": "Statistik (Statistics), 9th Edition", page 119 - 20. "Oldenbourg Verlag GmbH, Munich",1993.ISBN 3-486-22055-1.